Sleep Efficiency Basics
Sleep efficiency describes how much of the time you spend in bed is actually spent asleep. It is often used in sleep medicine to summarize sleep continuity, not just total sleep time. For example, two people can both sleep 6 hours, but the person who spends 8 hours in bed has lower sleep efficiency because more time was spent awake.
The most common formula is: sleep efficiency equals total sleep time divided by time in bed, multiplied by 100. Total sleep time is the sum of minutes scored as sleep, while time in bed is the interval from “lights out” (or the start of the sleep window) to “wake up.”
In practice, sleep efficiency is reported as a percentage. A higher percentage means fewer minutes awake while in bed. A lower percentage can reflect trouble falling asleep, frequent awakenings, early morning waking, or a mismatch between the chosen sleep window and your actual sleep pattern.
Common Measurement Pitfalls
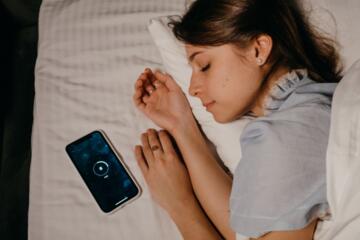
People often misinterpret sleep efficiency because the metric depends on how time in bed and total sleep time are defined. Wearables estimate sleep stages using motion and sometimes heart rate, but they do not directly measure brain activity. This matters most when you are awake but still, such as reading in bed, lying quietly with eyes closed, or dozing without falling asleep.
Another frequent issue is inconsistent “time in bed.” If you go to bed at 11:00 one night and 1:00 the next, but you compare sleep efficiency as if the sleep window were identical, the number can reflect behavior changes rather than sleep quality. Sleep efficiency also changes when you intentionally extend time in bed to “catch up,” because the denominator grows even if total sleep time does not.
Biologically, sleep efficiency is influenced by sleep latency (time to first sleep), wake after sleep onset (minutes awake after initially sleeping), and the stability of sleep across the night. Fragmentation increases wake after sleep onset, which lowers sleep efficiency even when total sleep time remains similar.
Real-world consequences show up in daily functioning. Low sleep efficiency often coincides with next-day sleepiness, reduced concentration, and mood changes, especially when the pattern persists. It can also lead to a cycle where people spend more time in bed to compensate, which can further reduce efficiency if they remain awake for longer stretches.
Measurement error can also bias the percentage. If a device overestimates sleep during quiet wakefulness, sleep efficiency rises. If it underestimates sleep during brief awakenings or restless movement, sleep efficiency falls. The direction of error varies by device, settings, and individual movement patterns.
Formula, Typical Ranges, And Limits
Sleep efficiency is calculated as: (total sleep time ÷ time in bed) × 100. If you are in bed for 8 hours (480 minutes) and you sleep for 6 hours (360 minutes), sleep efficiency is 360/480 × 100 = 75%.
Typical ranges depend on the context and the method used. In clinical sleep studies, sleep efficiency is often reported from polysomnography, which uses brain activity to score sleep. In consumer wearables, the same concept is estimated from sensor data. Because the measurement methods differ, a number that looks “normal” on one platform may not match another.
As a practical consumer interpretation, many people consider mid-to-high percentages as better continuity and lower percentages as more time awake in bed. However, there is no single universal cutoff that applies to everyone. A person with a naturally short sleep latency and few awakenings may consistently show higher values, while another person with similar total sleep time but more awakenings may show lower values.
Sleep efficiency is also sensitive to the chosen sleep window. If you define time in bed from “lights out” to “wake up,” but you spend 30 minutes awake before falling asleep, sleep efficiency drops even if your later sleep is consolidated. Conversely, if you only record the period you believe you are asleep, the denominator shrinks and the percentage rises.
Because of these dependencies, sleep efficiency works best as a trend metric. A consistent decline over weeks, or a sudden drop after a schedule change, can be more informative than a single night’s percentage.
How To Measure More Accurately
Use A Consistent Sleep Window
Choose a consistent rule for time in bed. For example, define time in bed as the interval between when you intend to sleep (lights out or sleep start) and when you intend to wake (final wake time). Keep this rule stable for at least 1–2 weeks so the denominator reflects your routine rather than shifting definitions.
This works because sleep efficiency is a ratio. If the denominator changes due to inconsistent logging, the percentage changes even when sleep itself does not. In practice, you can record the sleep window in a notes app or a sleep diary and compare it to the device’s reported sleep start and end.
Tools that help include a simple paper or digital sleep diary, a timer-based “lights out” log, and wearable sleep tracking with the same bedtime/wake settings each night. If your device allows you to set a sleep schedule, use it consistently.
Compare Trends, Not Single Nights
Look at averages across several nights rather than reacting to one low or high value. A single night can be distorted by an unusual bedtime, alcohol-related sleep disruption, illness, travel, or a device misclassification.
This approach works because measurement error and night-to-night variability average out. In practice, compute a weekly mean sleep efficiency from the same source (either your diary-based calculation or the wearable’s estimate). If your weekly mean drops by 5–10 percentage points while your sleep window stays consistent, that pattern deserves attention.
For a practical outcome target, aim for stability first. Many people find that improving consistency of bedtime and wake time produces a gradual rise in sleep efficiency over 1–3 weeks, though the size of change varies widely.
Cross-Check With Sleep Latency
Sleep efficiency blends multiple components, so it helps to separate them. Track sleep latency (minutes from sleep start to first sleep) using either diary estimates or the device’s “fall asleep” time. Also note awakenings that you remember and whether you returned to sleep quickly.
This works because a low sleep efficiency can come from long sleep latency, frequent awakenings, or early waking. If sleep latency is the main driver, the pattern often looks like a low efficiency with a long time before the first sustained sleep period. If awakenings dominate, the device may show repeated wake events and shorter sleep blocks.
In practice, you can record latency in 5-minute increments and count awakenings lasting longer than 10 minutes. Pairing these notes with sleep efficiency helps interpret whether the ratio is changing due to falling asleep later, staying asleep less, or both.
Understand Wearable Error Sources
Wearables can misclassify quiet wakefulness as sleep and can miss sleep during low movement. This is more likely when you lie still while awake, when you nap, or when you have restless movements that resemble wakefulness.
This matters because the formula depends on total sleep time. If a device overestimates total sleep time by even 30 minutes on a night, sleep efficiency can shift meaningfully. For example, with 8 hours in bed, an error of 30 minutes changes sleep efficiency by about 6.25 percentage points (30/480 × 100).
To reduce confusion, treat wearable sleep efficiency as an estimate of continuity rather than a precise measurement. If you want higher accuracy, use diary-based time in bed and rely on the device mainly for relative changes, not absolute values.
Educational Case Examples
Example 1 (Inconsistent sleep window): A person goes to bed at 10:30 one night and at 1:00 the next, then records sleep efficiency from the wearable without adjusting the sleep schedule. On the later night, the device shows a similar total sleep time, but sleep efficiency drops because the time in bed increased and the person spent more time awake before sleep. After setting a consistent sleep window and logging lights out and wake time, the weekly average sleep efficiency rises even though total sleep time changes little.
Example 2 (Quiet wakefulness): Another person reads in bed for 45 minutes with minimal movement before falling asleep. The wearable estimates that period as sleep, so sleep efficiency appears higher than expected. When the person logs sleep latency in a diary, the diary-based calculation shows a lower sleep efficiency than the wearable. Over several weeks, the wearable still tracks the direction of change, but the absolute percentage differs.
Sleep Efficiency Checklist
| Question | If Yes | Likely Effect On Sleep Efficiency | What To Do Next |
|---|---|---|---|
| Is your time in bed consistent? | You use the same sleep window rule most nights. | Less denominator noise; trends become clearer. | Track weekly averages and compare across weeks. |
| Do you know your sleep latency? | You log minutes awake before first sleep. | Helps explain low efficiency from delayed sleep. | Separate “falling asleep late” from “staying asleep poorly.” |
| Does the device overestimate quiet wake? | You read/lie still awake and the wearable scores sleep. | Wearable sleep efficiency may look higher than reality. | Use diary-based latency to interpret absolute values. |
| Are you comparing single nights? | You react to one low percentage. | Random error and unusual events dominate. | Use 7–14 night trends before drawing conclusions. |
Step-by-step quick check:
- Record lights out and final wake time for 7 nights.
- Log sleep latency (minutes awake before first sleep) for the same nights.
- Compute sleep efficiency using the same denominator rule each night.
- Compare the weekly average to your prior week and note whether latency or awakenings changed.
Practical Common Mistakes
One mistake is using sleep efficiency as a proxy for sleep quality without checking the components. A person can have moderate sleep efficiency but still experience unrefreshing sleep due to factors not captured by the ratio, such as sleep stage distribution or breathing-related sleep disruption.
Another mistake is “chasing” the number by changing bedtime and wake time in response to a low value. Because sleep efficiency depends on time in bed, shortening the sleep window without considering sleep latency and awakenings can create a pattern where the person spends more time awake earlier in the night.
People also mis-handle naps. Many wearables treat naps separately, but some users compare nap-influenced nights as if the sleep window were identical. Naps can reduce sleep pressure and alter nighttime latency, which changes sleep efficiency.
Finally, users sometimes ignore device settings. If a wearable uses an automatic sleep schedule that shifts by hours, the time in bed used for the percentage can change. Even when total sleep time looks similar, the ratio can move due to schedule differences.
FAQ
What Is The Sleep Efficiency Formula?
Sleep efficiency equals total sleep time divided by time in bed, multiplied by 100. Total sleep time is the minutes scored as sleep, and time in bed is the interval from sleep start to final wake time.
What Range Of Sleep Efficiency Is Typical?
Ranges vary by measurement method and by how time in bed is defined. In consumer tracking, sleep efficiency is best interpreted as a personal trend rather than a single universal cutoff.
Why Does My Wearable Show A Different Number Than My Diary?
Wearables estimate sleep from movement and sometimes heart rate, which can misclassify quiet wakefulness as sleep. A diary-based calculation depends on your logged sleep window and sleep latency.
How Much Error Can Affect Sleep Efficiency?
Because sleep efficiency is a ratio, a 30-minute error in total sleep time can shift the percentage by about 6.25 points when time in bed is 8 hours. The exact impact depends on your denominator.
Should I Worry About One Low Night?
A single night can reflect unusual circumstances or sensor misclassification. Looking at weekly averages and checking sleep latency and awakenings gives a more reliable picture.
Author's Insight
Sleep efficiency is a ratio that mixes two measurable ideas: how long you stay in bed and how much of that time is scored as sleep. That structure makes it sensitive to logging choices and to wearable scoring assumptions, especially when you lie still while awake. The most useful way to interpret it is to keep the sleep window consistent, track sleep latency and awakenings, and focus on trends over 1–2 weeks. Absolute values from different devices or different definitions should not be treated as interchangeable.
Key Takeaways
- Sleep efficiency equals total sleep time divided by time in bed, multiplied by 100.
- Wearables estimate sleep and can misclassify quiet wakefulness, shifting the percentage.
- Use consistent sleep-window rules and review weekly averages rather than single nights.
- Pair sleep efficiency with sleep latency and awakening notes to understand what drives changes.
- Interpret the number as a continuity trend, not a direct measure of sleep quality.