Sodium Grams And Risk
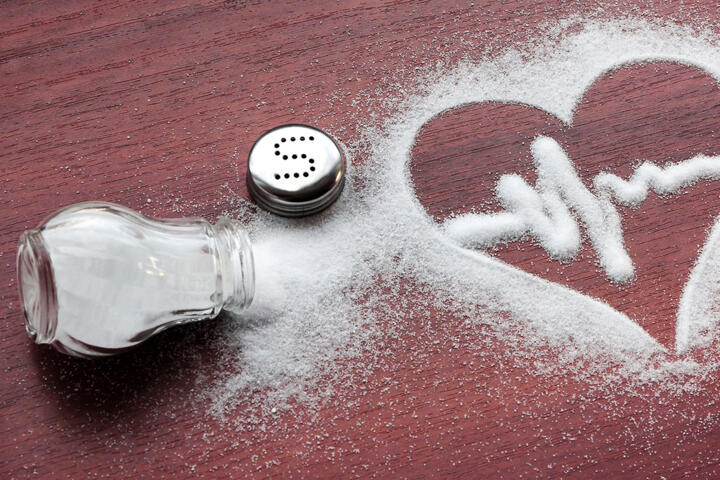
Sodium is a mineral used for nerve signaling and fluid balance. In most diets, sodium intake comes mainly from processed and restaurant foods, not from the salt shaker. When sodium intake rises, the body must excrete more sodium through the kidneys, and blood volume can increase. Over time, higher sodium exposure can raise blood pressure in many people, and higher blood pressure increases the risk of stroke, heart failure, and kidney disease.
Daily sodium intake is often discussed in grams, but food labels list sodium in milligrams. A practical conversion helps: 1 gram of sodium equals 1000 mg of sodium, and 1 gram of sodium is roughly 2.5 grams of salt (sodium chloride). Many nutrition labels also show “% Daily Value,” but those values do not reflect individual risk. The risk discussion depends on how much sodium people consume each day and how their bodies respond.
To make the grams concrete, consider common sources. A single slice of many breads can contain around 100–200 mg sodium. A bowl of soup may contain 600–1200 mg sodium depending on the recipe. A typical fast-food sandwich can range from 800–1500 mg sodium, and a single serving of pizza can often fall in the 500–1500 mg sodium range. These numbers vary widely by brand and portion size, but they show why “small” choices add up quickly.
What People Get Wrong
Many people underestimate sodium because they focus on added salt while ignoring sodium already present in bread, sauces, cured meats, cheese, and packaged snacks. Sodium is also hidden in foods that taste savory rather than salty, such as deli turkey, instant noodles, and some breakfast cereals. The body does not distinguish sodium from different sources; what matters is total intake.
Another common error is treating “low sodium” claims as a free pass. Labels can be confusing: a product labeled “low sodium” may still contain enough sodium to raise daily totals when eaten in normal portions. People also sometimes switch to one “healthier” item that is lower in sodium but then replace it with another high-sodium item, leaving total intake unchanged.
Biologically, sodium affects blood pressure through several pathways. Higher sodium intake can increase extracellular fluid volume, which raises cardiac output and blood pressure. In some individuals, the kidneys excrete sodium less efficiently or the blood vessels respond more strongly to sodium-related signals. Chronic high sodium can also influence vascular stiffness and hormone systems that regulate salt and water balance. These mechanisms do not affect everyone the same way, which is why sodium reduction can help some people more than others.
Real-world consequences often show up indirectly. People with higher baseline blood pressure may experience larger blood pressure increases with high sodium intake. Over years, sustained elevations in blood pressure contribute to vascular damage. Kidney disease can also worsen with high sodium because the kidneys must work harder to excrete sodium and maintain fluid balance.
It is also easy to misread “normal” intake. Many adults consume sodium above recommended limits even when they avoid obvious salty foods. If someone eats restaurant meals several times per week and relies on packaged foods for convenience, daily sodium can climb without any single meal feeling extreme.
Daily Targets And Practical Steps
Translate Labels Into Grams
Start by converting label sodium into daily grams. If a serving contains 400 mg sodium, that equals 0.4 grams. Add up servings realistically: a “serving” on a package may be smaller than what you eat. For example, if you eat two servings of a snack with 300 mg sodium per serving, you consume 600 mg (0.6 grams) from that snack alone.
Use a simple daily cap approach rather than chasing perfect foods. Many public health recommendations aim for less than 2 grams of sodium per day (about 5 grams of salt) for adults, with lower targets sometimes discussed for people with hypertension or kidney disease. Not every guideline uses the same number, but the direction is consistent: lower sodium intake generally reduces blood pressure in many people.
In practice, you can set a “budget” for each meal. If your daily target is 2 grams sodium, then 500 mg per meal leaves room for snacks and beverages. This method works because sodium intake is cumulative and meal-by-meal choices determine the total.
Choose Lower-Sodium Patterns
Lower sodium patterns usually involve shifting the main sodium sources rather than removing every salty item. A practical approach is to reduce high-sodium categories first: processed meats, instant noodles, canned soups, salty sauces, and packaged snacks. These foods often contribute large sodium amounts per serving.
Replace with options that still fit the same meal structure. For example, swap cured deli meat for grilled chicken or beans, choose no-salt-added canned beans when available, and use herbs, citrus, garlic, vinegar, or salt-free seasoning blends for flavor. These changes work because they reduce sodium at the source while keeping meals satisfying.
Look for “no salt added” or “reduced sodium” versions, but check the actual mg per serving. If a “reduced sodium” product drops from 800 mg to 600 mg per serving, it helps but may still be high depending on your daily total. The goal is to lower the grams you actually eat.
Manage Restaurant And Packaged Meals
Restaurant meals often contain more sodium than home-cooked meals because sauces, marinades, and cooking processes concentrate salt. A practical strategy is to ask for modifications when possible, such as sauce on the side, dressing on the side, or no added salt. If modifications are not available, choose items that are less sauce-heavy, such as grilled proteins with vegetables rather than stews or heavily seasoned dishes.
For packaged meals, check the sodium per serving and the number of servings per container. Some “single-serve” items contain more than one serving, and some frozen dinners list sodium per serving with two servings in the package. If you eat the whole package, multiply accordingly.
Realistic outcomes depend on baseline intake. If someone currently consumes around 3.5–5 grams sodium per day and reduces to around 2–3 grams by changing a few high-sodium items, blood pressure often trends downward in many people. The magnitude varies, and some individuals respond more than others.
Track Intake Without Obsession
Short-term tracking can clarify where sodium comes from. A 3–7 day food log, using label data or a reputable nutrition database, helps identify the top contributors. Many people discover that 2–4 foods account for a large share of daily sodium.
After identifying the main sources, adjust one or two categories rather than changing everything at once. For example, replacing one high-sodium lunch per day with a lower-sodium option can reduce daily intake by several hundred milligrams. Consistency matters more than perfection because sodium intake fluctuates day to day.
If you have hypertension, kidney disease, or heart failure, sodium targets may be lower and should be discussed with a clinician. Even then, the practical steps remain similar: read labels, reduce high-sodium categories, and monitor total grams rather than focusing on a single meal.
Case Examples Of Intake
Example 1: Packaged Lunch Pattern
A 38-year-old eats a packaged sandwich and chips for lunch. The sandwich contains 900 mg sodium, and the chips add 250 mg. Dinner includes a frozen meal with 1100 mg sodium per serving, and the person eats the whole package. Snacks include a yogurt drink with 150 mg sodium. Total sodium for the day is 900 + 250 + 1100 + 150 = 2400 mg (2.4 grams) without adding any salt at home. This pattern shows how “normal” convenience foods can reach or exceed common daily targets.
Example 2: Restaurant Meals Several Times
A 52-year-old eats restaurant meals three times per week and home-cooked meals on other days. On restaurant days, a meal includes a sandwich with 1300 mg sodium and a side soup with 800 mg sodium, totaling 2100 mg for that meal. The person also has breakfast cereal (300 mg) and an evening snack (200 mg). On those days, total sodium is about 2600 mg (2.6 grams). On home-cooked days, sodium might average 1500–2000 mg depending on added salt and ingredient choices. This example illustrates how weekly patterns can raise average intake even when home meals are moderate.
Sodium Intake Checklist
| Daily Sodium (Grams) | Salt Approximation | Typical Food Pattern | Decision Support |
|---|---|---|---|
| ~1.0–1.5 g | ~2.5–3.8 g salt | Mostly minimally processed foods; limited sauces and packaged meals | Often feasible with careful label reading; confirm with a short log if unsure |
| ~1.5–2.3 g | ~3.8–5.8 g salt | Some packaged foods; sauces and restaurant meals kept to smaller portions | A common target range for many adults; focus on the top 2–3 sodium sources |
| ~2.3–3.5 g | ~5.8–8.8 g salt | Frequent deli meats, soups, noodles, pizza, or restaurant meals | Consider reducing one high-sodium category and one restaurant meal per week |
| >3.5 g | >~8.8 g salt | Multiple high-sodium packaged meals or large portions of salty foods | A higher-risk pattern for blood pressure; start with label-based swaps and portion control |
These ranges support decision-making, not individual diagnosis. Sodium needs and risk vary by health status, medications, and baseline blood pressure.
Common Mistakes To Avoid
- Assuming “low sodium” means “low enough.” Check mg per serving and compare it to your daily grams.
- Ignoring serving size. Many packaged foods list sodium per serving while the package contains multiple servings.
- Relying on taste alone. Foods can taste mildly salty yet contain high sodium due to sauces, broths, and seasoning blends.
- Reducing salt while increasing other sodium sources. For example, swapping one salty item for another with similar sodium keeps total grams high.
- Making large changes without monitoring. If you reduce sodium substantially, track intake for a week to confirm the change affects total grams.
FAQ
How many grams of sodium are in salt?
Salt is sodium chloride. About 1 gram of sodium equals roughly 2.5 grams of salt. Food labels list sodium, so converting helps compare targets.
Does sodium only affect blood pressure?
Sodium influences fluid balance and blood vessel function, which affects blood pressure. Higher blood pressure then contributes to cardiovascular and kidney outcomes over time, but sodium also interacts with kidney handling and hormone systems.
Is “reduced sodium” always enough?
Not always. Reduced sodium products can still contain substantial sodium per serving. The practical question is how many grams you eat across the day, not the marketing term.
Can I reach low sodium without cooking?
Yes, but it requires label-based choices. Prioritize lower-sodium versions of bread, soups, sauces, and snacks, and watch portion sizes and servings per package.
Should everyone aim for the same sodium target?
Targets vary by health status and clinician guidance. People with hypertension, kidney disease, or heart failure may need lower sodium goals, while others may have different considerations.
Author's Insight
Sodium risk is best understood as a dose-and-response issue: higher daily sodium grams tend to raise blood pressure in many people, and long-term blood pressure elevation increases cardiovascular and kidney risk. The most actionable part for consumers is identifying the main sodium sources, because a few foods often drive most of the daily grams. Label reading works when it is paired with realistic portion tracking, since “serving” sizes can mislead. Evidence supports sodium reduction for blood pressure in many populations, but individual response varies, and the safest target depends on health conditions and medications.
Key Takeaways
- Daily sodium intake is cumulative; grams add up from bread, sauces, soups, deli meats, and restaurant meals.
- Convert label sodium from mg to grams and multiply by how much you actually eat.
- Lower sodium patterns usually come from swapping high-sodium categories and reducing sauce-heavy or packaged meals.
- Use short-term tracking to find the top sodium sources, then change one or two categories for a measurable reduction.
- Individual targets vary with health status, so discuss sodium goals with a clinician when you have hypertension, kidney disease, or heart failure.