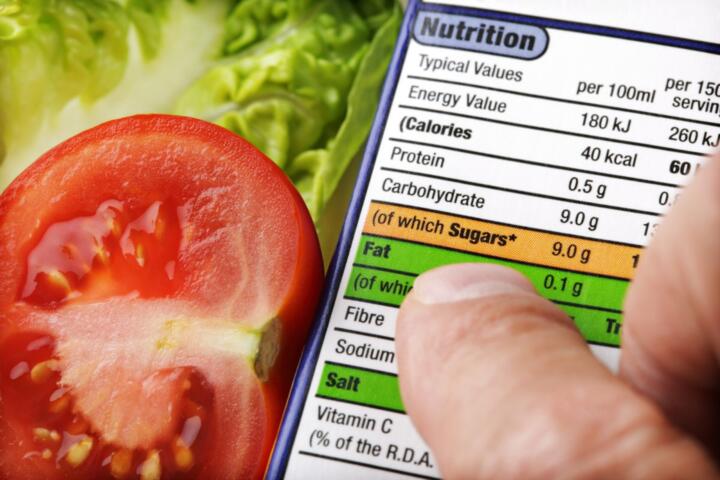
Serving Size Vs 100g
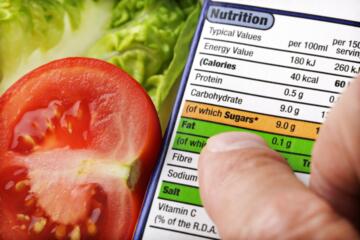
Nutrition labels commonly list nutrients in two ways: per serving (the amount the label defines as one “serving”) and per 100 g (or per 100 mL for drinks). The same product can look healthier or less healthy depending on which column you use, because serving size changes the numbers you see.
For example, a snack bar labeled as 40 g per serving will show higher fat or sugar per serving than a 100 g column would suggest. A yogurt cup labeled as 150 g per serving will show a larger serving-size portion than a 100 g column, even if the product’s nutrient density stays the same.
Both formats are mathematically related, but they answer different questions. “Per serving” answers what you likely eat in one sitting. “Per 100 g” helps you compare nutrient density across products with different portion sizes.
Where People Get Misled
Many shoppers compare only the serving-size column across products. That approach breaks down when serving sizes differ, because the label’s “one serving” may represent different real-world amounts.
Biologically, the body’s exposure to nutrients depends on the total amount consumed, not the label format. If two foods have the same sugar per 100 g but different serving sizes, the serving-size column will reflect different total sugar intakes for the same “one serving” concept.
A common real-world scenario is comparing cereals. One brand may define a serving as 30 g, another as 45 g. If you compare only per serving, the brand with the larger serving size can appear to have more sugar or calories even when its nutrient density per 100 g is similar.
Another frequent issue involves “per 100 g” vs “per 100 mL.” Drinks can list energy and sugar per 100 mL, while solids use per 100 g. Mixing these units during comparison leads to incorrect conclusions about nutrient density.
Some labels also show “per serving” based on a portion that does not match typical eating patterns. People may eat two servings, snack on half a serving, or combine foods. Serving-size numbers can therefore understate or overstate actual intake.
Finally, nutrient rounding can matter when serving sizes are small. If a label rounds sugar to the nearest 0.1 g per 100 g, converting to serving size can create small differences that look meaningful but reflect rounding rather than true formulation changes.
How To Compare Correctly
Use 100g For Cross-Brand
To compare nutrient density across brands, focus on the per 100 g column for solids and per 100 mL for liquids. This method answers: “If I eat the same weight of each product, how do the nutrients compare?”
In practice, write down the nutrient values per 100 g for the specific nutrient you care about, such as added sugar, sodium, or saturated fat. Then compare those values across products regardless of serving size.
A practical tool is a simple spreadsheet or notes app. Create rows for products and columns for the nutrients you track. Enter only the per 100 g (or per 100 mL) values to keep comparisons consistent.
Realistic outcome: you reduce the chance of choosing a product that looks better on “per serving” but is actually similar or worse when you account for portion differences.
Convert Serving To Your Portion
To estimate what you will actually consume, convert the label’s serving-size information to your portion size. If you eat 70 g of a food labeled as 40 g per serving, you are eating 1.75 servings.
In practice, multiply the nutrient per serving by the fraction of servings you eat. If the label provides per 100 g, you can also multiply per 100 g by your grams consumed and divide by 100. Both approaches should match closely, aside from rounding.
Example: if a product lists 200 kcal per 40 g serving, then 70 g is 200 × (70/40) = 350 kcal (before rounding effects). This method helps connect label numbers to intake.
Realistic outcome: you can compare foods based on the amount you plan to eat, not the label’s assumed portion.
Check Units And Serving Basis
Before comparing, confirm the label’s unit and basis. Look for “per 100 g,” “per 100 mL,” and “per serving.” For drinks, many people accidentally compare per 100 g values from solids with per 100 mL values from beverages, which are not interchangeable.
Also check whether the serving size is a weight (g) or volume (mL). Some products list serving size as a household measure (for example, “1 cup”) and also provide grams; use the grams or mL for conversions.
In practice, scan the label for the nutrient column you will use first. If you plan to compare across brands, start with per 100 g or per 100 mL. If you plan to estimate intake, start with your portion size and convert from either serving or 100 g.
Realistic outcome: you avoid unit errors that can flip a comparison.
Watch Sodium And Added Sugar
When comparing processed foods, sodium and added sugar often drive meaningful differences. Sodium is tied to blood pressure regulation through effects on fluid balance and vascular function, while added sugar contributes to total energy intake and can affect blood glucose patterns depending on the overall meal composition.
Labels may list “sugars” without specifying added vs naturally occurring sugars. If the label provides “added sugar,” use that for comparisons aimed at limiting added sugars. If it does not, “sugars” still helps compare total sugars, but it does not separate added from intrinsic sugars.
In practice, compare sodium per 100 g first, then convert to your portion. For example, if one product has 300 mg sodium per 100 g and you eat 60 g, the sodium estimate is about 180 mg (again, rounding may shift the last digits).
Realistic outcome: you make comparisons aligned with nutrients that often vary more across brands than, for example, fiber in some categories.
Educational Case Examples
Case 1: Cereal with different serving sizes. Two cereals list sugar per serving and per 100 g. Brand A shows 6 g sugar per 30 g serving and 20 g sugar per 100 g. Brand B shows 9 g sugar per 45 g serving and 20 g sugar per 100 g. Per serving, Brand B looks worse (9 g vs 6 g), but per 100 g they match. If you eat 45 g of cereal, both cereals provide about 9 g sugar, because the nutrient density is the same.
Case 2: Yogurt cup vs 100 g comparison. A yogurt is sold in a 150 g cup labeled as one serving. The label lists 6 g sugar per 100 g and 9 g sugar per serving. Another yogurt lists 8 g sugar per 100 g and 12 g sugar per serving, with a similar cup size. Comparing per 100 g shows the second yogurt has higher sugar density, and converting to the cup size confirms the serving totals differ in a way that matches the density difference.
Serving Vs 100g Checklist
| Decision Goal | Use This Label Column | What You Compare | Common Pitfall |
|---|---|---|---|
| Compare brands | Per 100 g (or 100 mL) | Nutrient density for the same unit | Comparing per serving across different serving sizes |
| Estimate intake | Convert to your portion | Total nutrients for the grams you eat | Using serving totals without adjusting for eating more or less |
| Compare drinks | Per 100 mL | Sugar, calories, and sodium per volume | Mixing 100 g and 100 mL values |
| Compare sodium | Per 100 g, then convert | Sodium per weight eaten | Relying on per serving when serving size differs |
Step-by-step checklist:
- Pick the nutrient you want to compare (for example, sugar, saturated fat, sodium).
- Confirm the unit: per 100 g for solids, per 100 mL for liquids.
- Compare per 100 g (or 100 mL) across products to judge nutrient density.
- Estimate your portion in grams or mL.
- Convert using either per serving or per 100 g so the final numbers reflect what you will eat.
- Check rounding and serving-size definitions when values look close.
Common Mistakes To Avoid
- Comparing only per serving. This often favors products with smaller label servings and penalizes those with larger ones, even when nutrient density is similar.
- Ignoring the serving size definition. Some servings represent a small portion, while others represent a full cup or packet. Intake estimates change when you eat more than one serving.
- Mixing grams and milliliters. Comparing per 100 g from a solid with per 100 mL from a drink can produce wrong conclusions because the reference units differ.
- Assuming “low per serving” means low per 100 g. A product can have low per serving because the serving is small, while still having moderate nutrient density.
- Over-interpreting tiny differences. Label rounding can create small gaps that do not reflect meaningful formulation changes.
- Using sugars without context. “Sugars” may include naturally occurring sugars. If added sugar matters for your goal, look for an “added sugar” line when available.
FAQ
Which column should I trust more?
Use per 100 g (or 100 mL) for cross-brand comparisons of nutrient density, then convert to your portion to estimate what you actually consume.
How do I convert serving size to my portion?
Estimate how many grams or mL you eat, then multiply the label’s nutrient per serving by (your portion ÷ label serving). The result should match a conversion from the per 100 g column, aside from rounding.
Why do two foods look different per serving?
Serving sizes often differ. Per serving numbers reflect the label’s assumed portion, so the same nutrient density can produce different serving totals.
What if the label lists per 100 mL for a drink?
Compare drinks using per 100 mL values, then convert to the volume you drink. Do not compare per 100 mL drink values directly to per 100 g solid values.
Do rounding differences change the decision?
Small differences can come from rounding. If values are close, focus on per 100 g density and consider the nutrient amount for your actual portion rather than the last decimal place.
Author's Insight
Serving size and 100 g columns describe the same product in different reference frames. Per serving answers “what does one labeled portion contain,” while per 100 g answers “how concentrated is the nutrient.” Confusion usually comes from comparing across products without aligning the reference frame or without converting to the portion you eat.
A practical approach is to choose one nutrient, compare per 100 g (or 100 mL) across brands, then convert to your planned portion. This method reduces errors from different serving sizes and unit mismatches.
Labels can still vary in how they report sugars and rounding, so readers should interpret small differences cautiously and focus on the totals for the amount they actually consume.
Key Takeaways
- Use per 100 g (or 100 mL) to compare nutrient density across brands.
- Use conversion to your portion to estimate total intake for what you plan to eat.
- Check units and serving-size definitions to avoid misleading comparisons.
- Focus on the nutrient you care about, such as sodium or added sugar, and interpret label rounding realistically.