Heart Rate And Performance
Recovery metrics help you decide whether your body is ready for the next training block, a harder workout, or a demanding day. Heart rate is a direct readout of cardiovascular strain, while performance measures reflect how well muscles, coordination, and energy systems are functioning. Using both together reduces the risk of trusting a single signal that may change for reasons unrelated to recovery.
For example, after a hard interval session, resting heart rate may stay elevated for a day or two, while a simple performance test like a 5-minute steady run might feel unusually difficult. In contrast, some people see heart rate return toward baseline quickly but still perform poorly because muscle soreness, tendon stiffness, or nervous-system fatigue has not resolved.
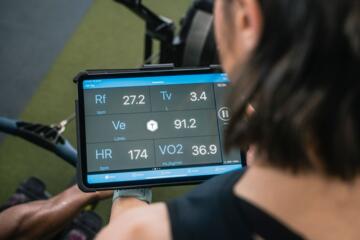
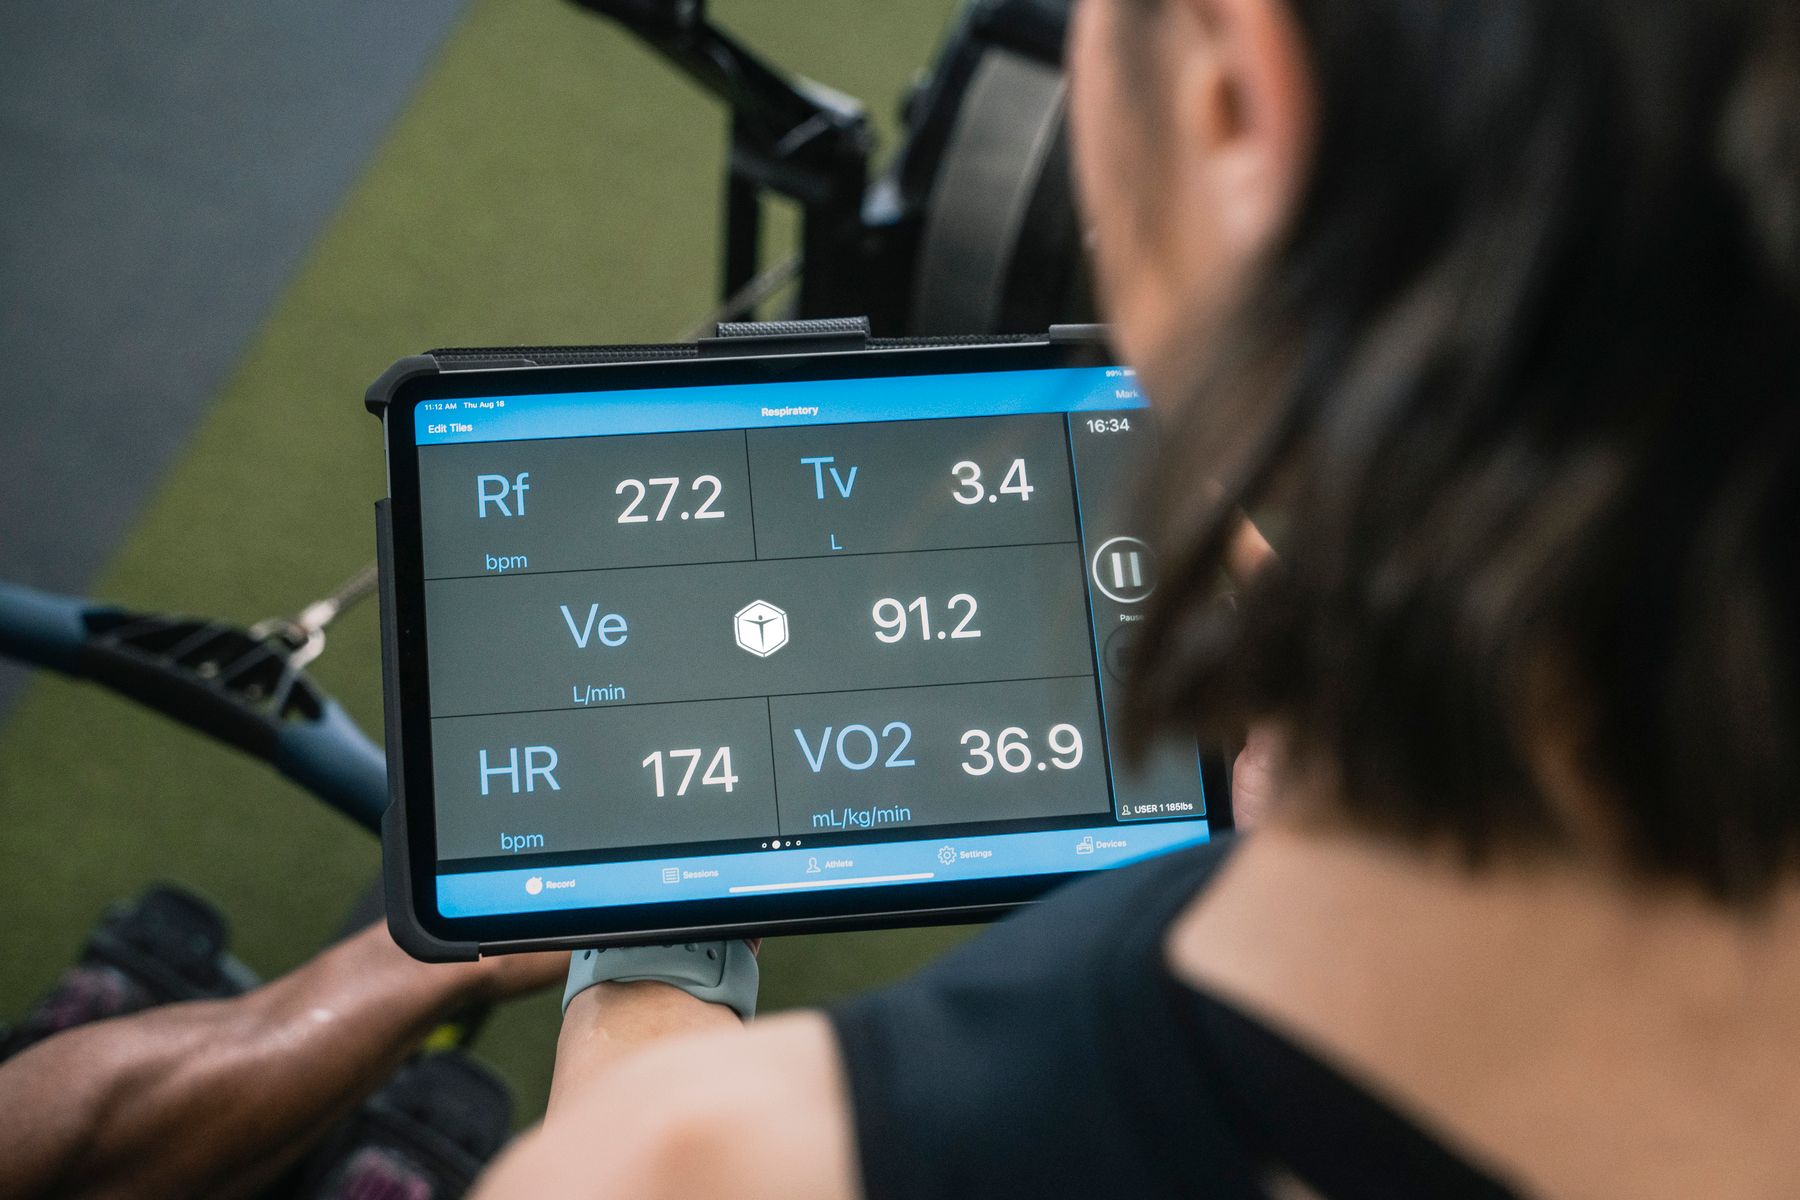
Heart rate-based metrics often include resting heart rate, heart-rate variability trends, and heart rate during a standardized submaximal effort. Performance measures include time-to-complete, repetitions at a given load, power output, pace, jump height, or perceived exertion relative to output. The key is to interpret changes as patterns over time rather than as single-day verdicts.
Why People Misread Recovery
A common mistake is treating a single heart-rate number as a direct measure of readiness. Resting heart rate can rise from poor sleep, dehydration, alcohol use, travel, stress, caffeine timing, or illness that has not yet produced obvious symptoms. In those situations, heart rate may signal “physiologic load” rather than “training fatigue.”
Another mistake is relying only on performance. Performance can drop due to technique changes, pacing errors, equipment differences, or normal day-to-day variability in motivation and attention. A person may feel “recovered” because pace is back to normal, while cardiovascular strain remains elevated during the same submaximal effort.
Biologically, heart rate responds to multiple inputs: autonomic nervous system balance, circulating catecholamines, blood volume, temperature, and respiratory demand. Training fatigue also affects these systems, but so do external factors. Performance depends on additional layers such as muscle contractile function, neuromuscular coordination, and substrate availability, which may recover on different timelines than cardiovascular measures.
Real-world consequences include pushing into another hard session while the body is still under elevated strain, which can increase the chance of prolonged soreness or injury risk. The opposite error also happens: backing off too long because heart rate is elevated from a non-training factor, even though training adaptations are progressing.
How To Track Both Signals
Use Standardized Heart-Rate Tests
Pick one or two heart-rate checks that you can repeat with minimal variation. A practical example is measuring resting heart rate each morning after waking, before caffeine, while keeping sleep timing consistent. Another option is heart rate during a fixed submaximal effort, such as a 10-minute brisk walk at a consistent pace or a set cycling workload.
This works because submaximal heart rate is sensitive to changes in cardiovascular strain and autonomic recovery. If heart rate is higher than your usual value at the same effort, it suggests reduced recovery or increased physiologic stress. In practice, many people notice that a meaningful deviation is not a tiny fluctuation but a persistent shift across multiple sessions.
Relevant tools include a wearable that records heart rate reliably, a timer for consistent warm-up and effort duration, and a simple log that records sleep duration, caffeine timing, and perceived stress. If your wearable has inconsistent readings, especially during movement, prioritize resting heart rate and a controlled submaximal test where the sensor stays stable.
Realistic outcomes: over 2–4 weeks, you can often identify your personal “normal range” for resting heart rate and submaximal heart rate. The goal is trend detection, not chasing a single target number.
Choose Performance Measures With Context
Select performance metrics that match your training goals and that can be repeated safely. For endurance training, a common approach is tracking pace at a fixed duration, time to complete a familiar distance, or power at a given heart-rate zone. For strength-focused training, track repetitions at a consistent load, total reps across sets, or bar speed if you have access to a device.
This works because performance reflects recovery of muscular and neural systems, which may lag behind cardiovascular recovery. In practice, you can compare performance on the same day-of-week and similar conditions, such as similar terrain, temperature, and equipment settings. Pairing performance with a simple readiness rating helps interpret whether a drop is likely fatigue-related or due to external factors.
Relevant tools include a training log, a stopwatch, and a consistent warm-up routine. If you use perceived exertion, record it alongside output so you can detect “more effort for the same output,” which often aligns with incomplete recovery.
Realistic outcomes: performance metrics usually show more day-to-day noise than heart-rate trends. A single poor session is less informative than a pattern of repeated underperformance at the same effort level.
Combine Metrics Into A Readiness Rule
Use a decision rule that considers both heart rate and performance rather than choosing one. One practical example is: if resting heart rate is elevated for two or more mornings and submaximal heart rate is higher at the same workload, treat the next session as “recovery or low intensity.” If resting heart rate is normal but performance is down, consider that neuromuscular fatigue or soreness may be the limiting factor and adjust session structure accordingly.
This works because it separates cardiovascular strain from muscular readiness. Elevated heart rate with normal performance can still indicate higher physiologic load, while normal heart rate with poor performance can indicate local fatigue, technique disruption, or incomplete neuromuscular recovery.
In practice, you can set thresholds based on your own baseline. For instance, define your baseline as the median of your last 2–3 weeks of resting heart rate and submaximal heart rate at the same workload. Then flag days when values exceed your baseline by a chosen margin and persist across more than one check.
Relevant tools include a spreadsheet or app that calculates rolling averages and highlights deviations. Realistic outcomes: most people improve decision quality within a few weeks because the rule becomes anchored to personal variability rather than generic targets.
Account For Confounders And Illness
Heart rate is sensitive to factors outside training, so record confounders that commonly shift it. Sleep duration and quality, hydration status, alcohol intake, caffeine timing, ambient temperature, and recent stress can all change resting heart rate and submaximal heart rate. If you have symptoms such as fever, new persistent cough, chest discomfort, or unusual shortness of breath, heart-rate changes should be treated as a health signal rather than a training metric.
This works because it prevents misattribution. A high resting heart rate after a late night or a long travel day may not reflect training fatigue, and a performance drop during a mild illness may reflect systemic effects rather than local muscle recovery.
In practice, add a short daily note: sleep hours, perceived stress, and any symptoms. If symptoms appear, pause training decisions and seek appropriate medical advice rather than using metrics to “push through.”
Relevant tools include a symptom checklist and a consistent time window for resting heart rate measurement. Realistic outcomes: accounting for confounders reduces false alarms and helps you interpret recovery signals more accurately.
Educational Case Examples
Endurance Runner With Elevated HR
A runner logs resting heart rate each morning and performs a 10-minute steady run at a fixed pace twice per week. After a hard interval workout, resting heart rate rises for three mornings and submaximal heart rate during the steady run is higher than the runner’s usual value at the same pace. The runner’s pace is slightly slower, and perceived exertion is higher. The combined pattern suggests incomplete recovery and higher cardiovascular strain, so the runner chooses a lower-intensity session and delays the next interval day.
Strength Trainee With Normal HR
A strength trainee tracks resting heart rate and records total repetitions at a consistent load for a main lift. After a heavy lower-body week, resting heart rate returns to baseline within one morning and submaximal heart-rate response during warm-up is normal. Performance metrics show fewer repetitions and slower bar speed for the first set, while perceived soreness is high. The pattern points more toward local muscular and neuromuscular fatigue than systemic cardiovascular strain, so the trainee reduces volume for the next session while keeping technique-focused work.
Heart Rate Vs Performance Checklist
| Signal Pattern | Likely Interpretation | What To Check Next | Practical Session Choice |
|---|---|---|---|
| Resting HR ↑ and Submax HR ↑ | Higher physiologic strain; recovery may be incomplete | Sleep, hydration, stress, temperature, symptoms | Lower intensity or shorter session; delay hard work |
| Resting HR normal but Performance ↓ | Local muscular or neuromuscular fatigue; technique disruption | Soreness, warm-up quality, form, load accuracy | Reduce volume or adjust exercise selection; focus on form |
| Resting HR ↑ but Performance normal | Cardiovascular strain from non-training factors | Caffeine/alcohol, travel, illness signs, heat exposure | Proceed cautiously; keep intensity moderate |
| Resting HR normal and Performance normal | Recovery likely adequate for planned work | Confirm with warm-up response and perceived exertion | Train as planned; still monitor for symptom changes |
Use this checklist as decision support, not a medical assessment. If you have red-flag symptoms such as chest pain, fainting, or severe shortness of breath, training metrics should not guide the next step.
Common Mistakes
One mistake is changing the test conditions while comparing days. If submaximal heart rate is measured at different paces, different routes, or different warm-up durations, the comparison becomes unreliable. Another mistake is measuring resting heart rate at inconsistent times or after caffeine, which shifts baseline autonomic tone.
People also overreact to wearable artifacts. Optical heart-rate sensors can misread during movement, cold weather, or loose straps. If readings jump abruptly without a physiologic reason, treat them as data quality issues and rely more on controlled measurements.
A frequent error is ignoring the time course. Heart rate and performance often recover at different speeds, so a single “good day” does not always mean full recovery. Tracking at least a week of trends helps separate normal variability from meaningful changes.
Finally, some people treat elevated heart rate as a reason to push harder to “burn off” fatigue. Elevated cardiovascular strain can reflect dehydration, heat stress, or early illness, and pushing intensity can worsen symptoms or prolong recovery.
FAQ
How Long Should I Track Trends?
Track at least 2–4 weeks to establish personal baselines for resting heart rate and submaximal heart rate at a fixed workload, then interpret new days against that baseline.
Is Resting Heart Rate Enough?
Resting heart rate alone often reflects sleep, stress, hydration, and illness as well as training load, so combining it with a standardized submaximal effort improves interpretation.
Why Can Performance Drop With Normal HR?
Muscle soreness, tendon stiffness, and neuromuscular fatigue can reduce output even when cardiovascular strain looks normal, especially after heavy strength or high-volume sessions.
What If My Wearable Heart Rate Is Noisy?
Use controlled measurements where the sensor stays stable, repeat tests under similar conditions, and treat obvious sensor errors as missing data rather than true physiologic changes.
When Should I Stop Using Metrics?
If you develop red-flag symptoms such as chest pain, fainting, severe shortness of breath, or fever, training decisions should shift to medical evaluation rather than metric-based adjustments.
Author's Insight
Heart rate and performance measure different parts of recovery. Heart rate reflects cardiovascular and autonomic responses to stress, while performance reflects muscular and neural function plus coordination and energy availability. The most reliable self-monitoring approach uses standardized tests, consistent conditions, and trend-based thresholds rather than single-day targets. Confounders like sleep, hydration, temperature, and early illness can shift heart rate without reflecting training fatigue, so pairing heart-rate checks with performance context reduces misinterpretation.
Key Takeaways
- Heart rate signals cardiovascular strain; performance signals how well you execute the task.
- Use repeatable tests and compare trends to your own baseline, not generic numbers.
- Elevated heart rate with normal performance often points to non-training stressors; normal heart rate with poor performance often points to local fatigue.
- Record sleep, hydration, temperature, and symptoms to avoid false conclusions.
- Stop relying on training metrics when red-flag symptoms appear and seek appropriate medical advice.