Hydration And BIA Accuracy
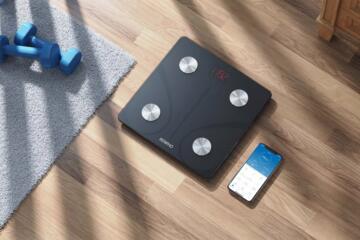
Bioelectrical impedance analysis (BIA) scales estimate body composition by sending a low-level electrical current through the body and measuring resistance (how much the current is slowed) and reactance (how the current interacts with cell membranes). The underlying assumption is that body water and body-cell mass influence these electrical properties in predictable ways. From those measurements, the device software converts resistance and reactance into estimates of fat mass, fat-free mass, and sometimes total body water.
Hydration status affects BIA readings because water conducts electricity. When total body water increases, resistance typically decreases, which the algorithm may interpret as higher fat-free mass and lower fat mass. When total body water decreases, resistance typically increases, which can shift the estimated body-fat percentage upward even if actual fat mass has not changed.
Practical examples show how this plays out. A person who measures after a long run, a salty meal, or a late evening with alcohol may see a different body-fat percentage than they would after a consistent morning routine. Even small changes in fluid distribution between blood plasma, interstitial fluid, and intracellular compartments can alter impedance without reflecting fat gain or loss.
BIA scales are often used for trend tracking, not for exact body-fat measurement. The direction and size of error can vary by device model, the person’s body size and composition, and the measurement conditions. Understanding hydration-related error helps you interpret changes more realistically.
Why Hydration Skews Body-Fat
Many people treat BIA as if it measures fat directly, but it measures electrical behavior. Fat tissue contains relatively little water compared with lean tissue, so the device uses water-related signals to infer fat mass. That inference becomes less accurate when hydration differs from the conditions assumed by the device’s prediction equations.
Recent food and drink intake can change impedance through water distribution and electrolyte shifts. A large meal increases blood flow to the gut and can alter fluid balance. High-sodium meals can increase extracellular fluid retention in some people, lowering resistance and producing an apparent drop in body-fat percentage.
Exercise is another common driver. During and after activity, muscles use glycogen and water, and the body may retain fluid for recovery. These changes can lower resistance and shift estimated body fat for hours, sometimes into the next day. The effect is not uniform across individuals; it depends on exercise intensity, duration, training status, and how quickly fluid balance returns to baseline.
Skin temperature and peripheral circulation also matter. BIA scales typically measure through the hands and feet. Cold feet or reduced circulation can increase resistance independent of internal body composition. This can make the device report higher body fat even when total body water is unchanged.
Menstrual cycle–related fluid changes can affect readings in people who menstruate. Hormonal shifts can alter water retention and electrolyte balance, which can move BIA estimates even when fat mass is stable. Sleep deprivation and stress can also influence fluid balance and sympathetic tone, which may affect peripheral circulation and impedance.
Possible consequences include over-correcting diet or exercise based on short-term BIA swings. For example, a two-day increase in estimated body fat after a salty meal may lead someone to cut calories aggressively, even though the change likely reflects water rather than fat. Over time, this can create inconsistent habits and confusing feedback.
Biologically, the key mechanism is that BIA algorithms assume a stable relationship between impedance and body composition. Hydration changes break that assumption by altering conductivity and the distribution of water between compartments. Because fat mass changes slowly, while hydration can change quickly, day-to-day BIA variability often reflects fluid rather than tissue remodeling.
What To Do For Better Tracking
Measure Under Consistent Conditions
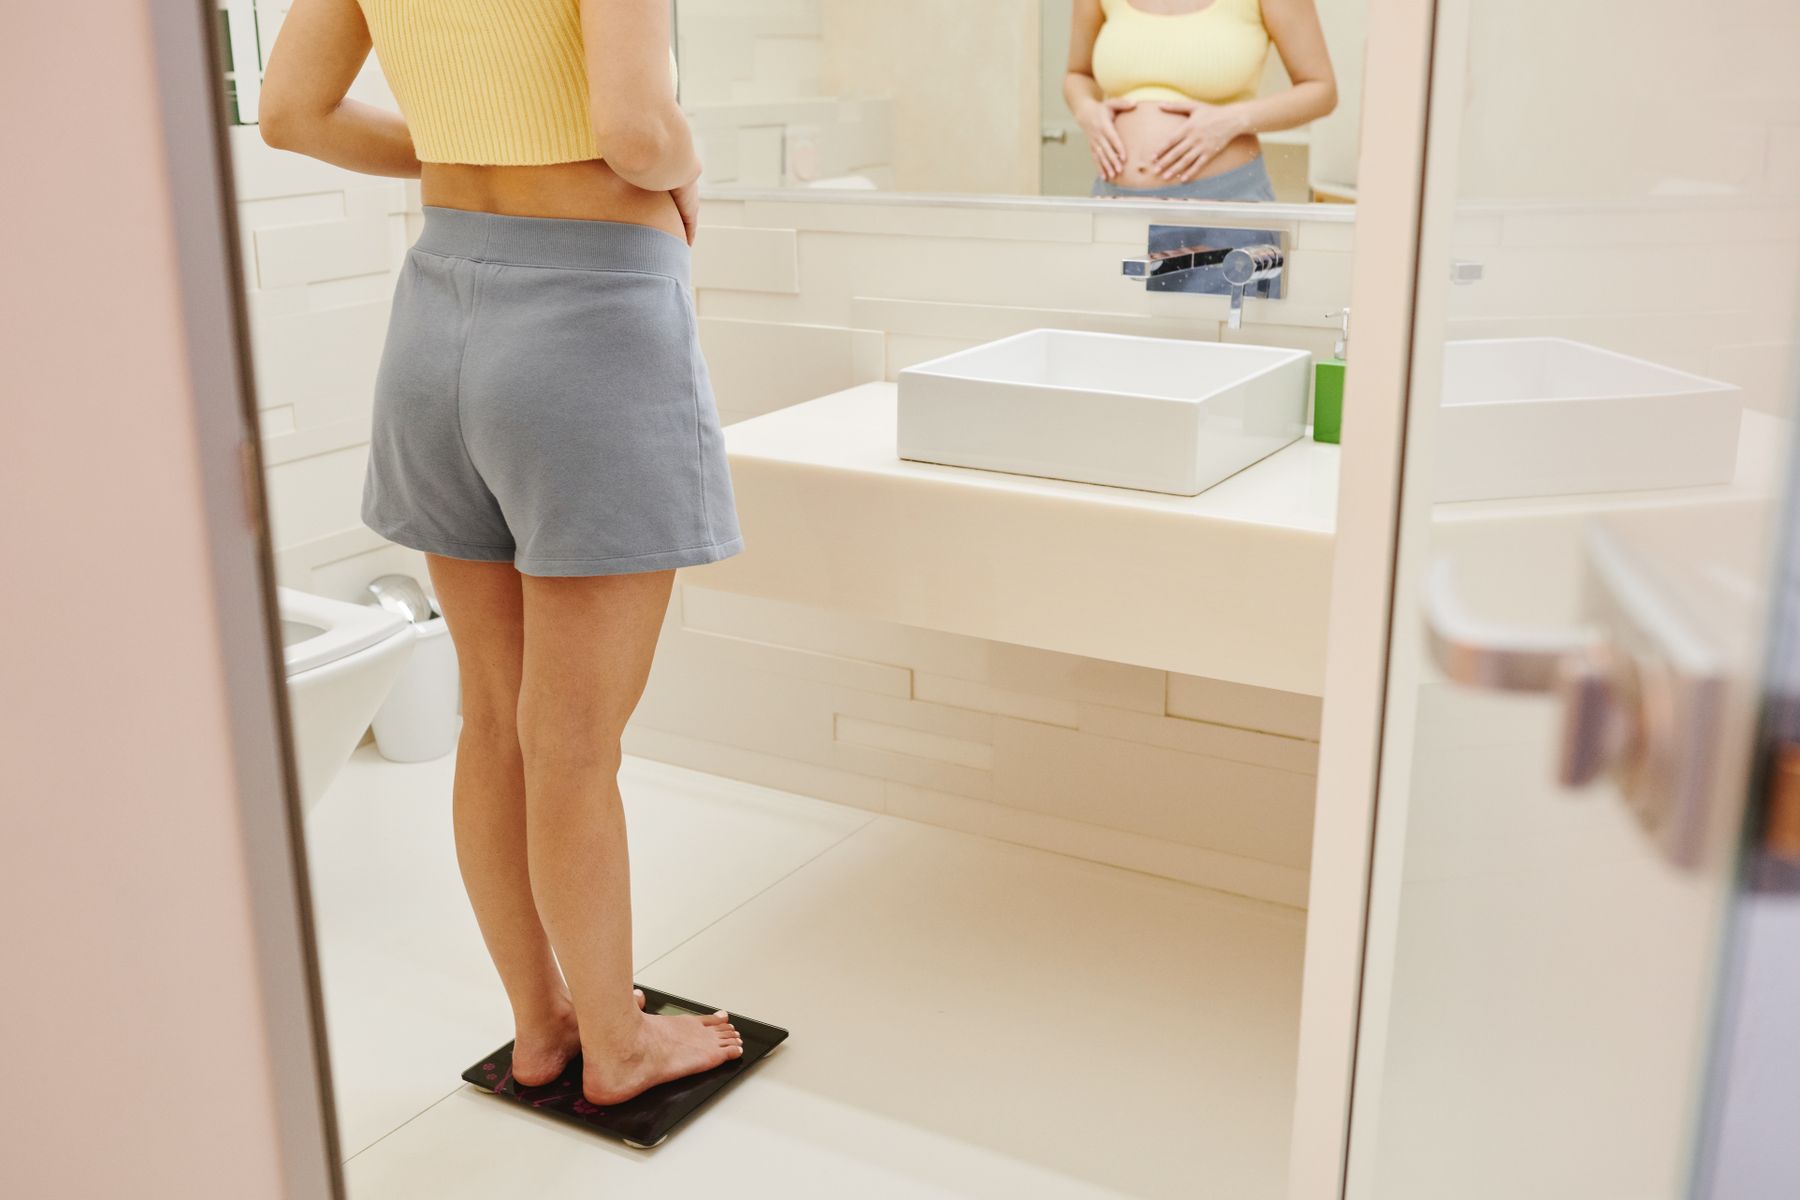
Use the same time of day and similar preparation each measurement. Many people get the most consistent trend by measuring in the morning after using the bathroom, before eating or drinking, and before exercise. Consistency reduces the chance that hydration shifts dominate the reading.
In practice, choose a routine you can repeat: step on the scale after drying your feet, avoid measuring immediately after a shower if your feet are still warm and wet, and keep room temperature similar. If you cannot measure under ideal conditions, record what differed (for example, “measured after workout” or “measured after late dinner”) so you can interpret outliers.
As a realistic expectation, even with consistency, day-to-day changes in estimated body fat can still occur. A common pattern is that readings fluctuate more after exercise, alcohol, or high-sodium meals, while weekly averages look more stable.
Separate Trends From Daily Noise
Focus on longer intervals rather than single measurements. Because hydration can change within hours, a single BIA reading is a weak signal for fat change. A better approach is to compare averages across multiple sessions.
For example, track 3–7 measurements per week under consistent conditions and review the weekly mean. If the weekly mean changes gradually over several weeks, that pattern is more likely to reflect real changes in body composition than a one-off spike or drop.
In practice, you can also compare BIA trends with other indicators that change more slowly, such as waist circumference measured at the same location and time, or progress photos under consistent lighting. These are not perfect, but they reduce the chance that hydration-driven BIA shifts steer decisions.
Account For Known Hydration Triggers
Identify situations that reliably move fluid balance and treat them as “measurement context.” Common triggers include intense exercise within the prior 12–24 hours, alcohol intake, high-sodium meals, and long periods without sleep. People who menstruate may also need to note cycle timing.
What to do is simple: avoid using BIA readings from those contexts to judge progress. If you do measure anyway, label the data and compare it only to similarly contextualized measurements.
Realistic outcomes: you may see larger swings in estimated body fat after triggers, sometimes reversing within a day or two. That pattern supports the hydration explanation rather than a rapid fat gain or loss.
Use Device Settings And Body Context
BIA scales often require age, sex, height, and sometimes activity level. Entering incorrect values can bias the device’s prediction equations. Skin contact quality matters too; dry, clean feet improve electrical contact and reduce random error.
In practice, verify that your profile settings match your current information and keep the same scale placement and stance each time. If the device offers a “mode” for athletes or different body types, use it only if it matches the manufacturer’s intended use; otherwise, stick to one mode to avoid mixing different algorithms.
Tools that help include a simple log (date, time, last meal, exercise, alcohol, and cycle day if relevant) and a spreadsheet that calculates weekly averages. This turns BIA from a daily judgment into a trend-monitoring tool.
Educational Case Examples
Example 1: Post-Workout Reading
A person measures body fat on a BIA scale the morning after a hard leg workout. The next day, the estimated body-fat percentage is lower than usual. The person repeats the measurement three more mornings under the same pre-meal routine and sees the reading return toward baseline. The likely explanation is exercise-related fluid and glycogen changes affecting impedance, not a sudden fat loss.
Example 2: High-Sodium Meal Effect
A person tracks BIA readings twice per week. After a weekend meal high in sodium, the device reports a higher body-fat percentage on the next measurement. Over the following week, when meals return to usual and measurements occur under the same morning routine, the estimate trends back down. The pattern fits extracellular fluid retention changing resistance rather than true fat gain.
BIA Error Checklist
| Situation | Likely Direction Of Bias | How To Handle It | What To Watch |
|---|---|---|---|
| Measured soon after exercise | Often lower estimated body fat (more water signal) | Use for context only; compare to similar days | Check whether readings normalize within 24–48 hours |
| High-sodium meal | Can shift estimates either way depending on fluid distribution | Avoid judging progress from the next reading | Look for a return to baseline over the week |
| Cold feet or poor contact | Often higher estimated body fat (higher resistance) | Warm up feet; dry and clean contact points | Repeat once after warming if results look extreme |
| Late eating or drinking | Often lower estimated body fat (more conductive fluid) | Measure before food and drink when possible | Compare only morning-to-morning readings |
| Menstrual cycle changes | Can move estimates without fat change | Track cycle phase and use weekly averages | Expect periodic shifts and focus on longer trends |
Common Mistakes
- Chasing daily numbers: Using a single BIA reading to judge fat loss or gain ignores that hydration changes faster than fat mass.
- Measuring at random times: Afternoon or evening measurements after meals and activity introduce fluid variability that the device cannot separate from body composition.
- Skipping profile accuracy: Incorrect age, sex, or height can bias the device’s prediction model and distort comparisons over time.
- Ignoring contact quality: Wet, cold, or dirty feet can increase measurement noise and create apparent changes unrelated to fat.
- Changing multiple variables at once: If you alter diet, exercise, sleep, and measurement timing simultaneously, it becomes hard to interpret whether BIA changes reflect behavior or hydration.
FAQ
How fast can BIA body-fat estimates change?
Estimated body-fat percentage can shift within hours when hydration and fluid distribution change, especially after exercise, alcohol, high-sodium meals, or late eating. Fat mass changes more slowly, so short-term swings often reflect water rather than tissue change.
Does drinking water before weighing affect BIA?
Yes. Drinking water shortly before a measurement can lower resistance and may lead to a lower estimated body-fat percentage. For trend tracking, measuring before food and drink reduces this source of variation.
Why do my readings differ on weekends?
Weekends often include different meal timing, higher sodium intake, alcohol, more activity, and later sleep. These factors change hydration and peripheral circulation, which can move BIA estimates even when body fat is stable.
Are BIA scales accurate for tracking progress?
BIA scales are more useful for within-person trend tracking than for exact body-fat values. Consistent measurement conditions and weekly averages improve interpretability, while day-to-day changes should be treated as noisy signals.
Can menstrual cycle changes affect BIA results?
Yes. Hormonal shifts can alter water retention and electrolyte balance, which changes impedance signals. Using weekly averages and noting cycle phase can reduce misinterpretation.
Author's Insight
BIA scales translate electrical measurements into body-composition estimates using prediction equations that assume a stable relationship between impedance and body water. Hydration status breaks that assumption, so the same person can see different body-fat estimates without any fat change. The most practical way to reduce error is not to chase a single reading, but to standardize measurement conditions and interpret weekly trends alongside other slower-changing markers like waist circumference. If you notice persistent, large discrepancies across consistent conditions, measurement context and device limitations are more likely explanations than sudden fat changes.
Key Takeaways
- BIA estimates body fat indirectly through electrical resistance, which changes with hydration and fluid distribution.
- Exercise, alcohol, high-sodium meals, late eating, skin temperature, and menstrual cycle shifts can move readings without fat change.
- Use consistent morning measurements when possible and review weekly averages rather than daily values.
- Log measurement context so you can separate hydration-driven swings from longer-term trends.