Recovery Scores: What They Mean
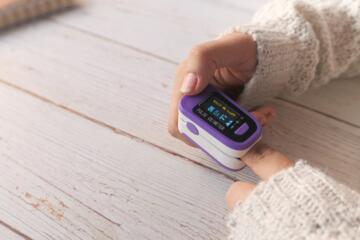
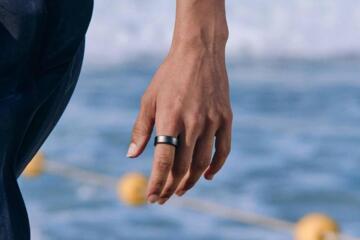
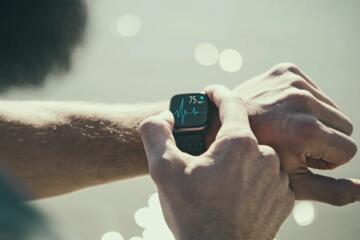
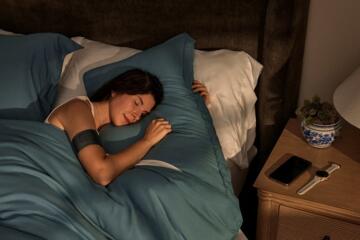
Wearable recovery scores are numerical summaries meant to reflect how your body is coping with recent stress and how ready it may be for the next bout of activity. Most systems blend signals such as heart rate patterns, heart rate variability, sleep duration and timing, resting heart rate trends, skin temperature, and movement intensity. Some also incorporate user inputs like age, sex, training history, or perceived exertion, then convert those inputs into a score that is displayed as a number or a color band.
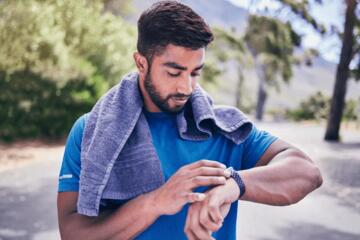
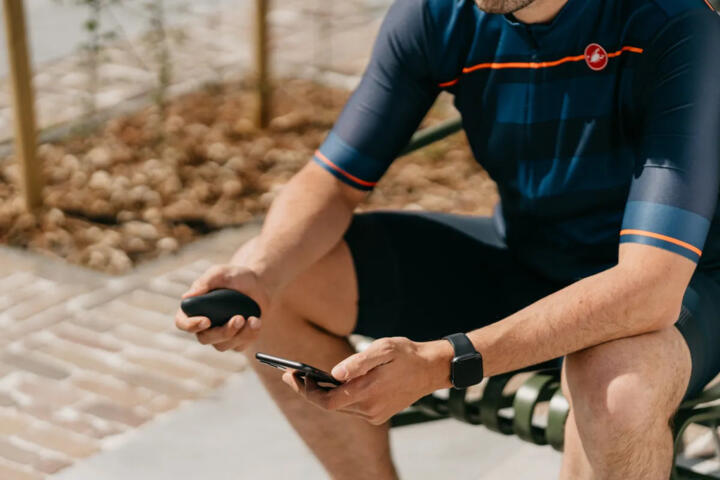
In practice, recovery scores are often used to decide whether to train hard, train lightly, or take rest. For example, a runner may see a low score after a late night and a hard interval session, then choose an easy run the next day. A cyclist may notice a consistently low score during a travel week and switch to shorter rides. These decisions can be reasonable, but the score itself depends on the algorithm behind it.
Two wearables can show different recovery numbers after the same day because they do not measure the same physiology in the same way, and they do not interpret it with the same rules. Understanding those differences helps you avoid treating the score as a universal truth.
Why Scores Differ Between Devices
Recovery scoring algorithms differ in three main places: the input signals, the preprocessing steps, and the decision logic that maps physiology to a score. Input signals vary because sensors differ and because some devices rely more heavily on heart rate variability while others emphasize sleep timing or resting heart rate. Preprocessing differs because motion artifacts, poor skin contact, and irregular breathing can distort heart rate and variability estimates. Decision logic differs because the algorithm may be trained to predict readiness for a specific outcome, such as perceived fatigue, next-day performance, or risk of overreaching.
Biologically, “recovery” is not a single measurable variable. After training, your body shifts through overlapping processes: muscle repair, glycogen replenishment, nervous system recovery, inflammation resolution, and sleep-dependent restoration. Heart rate variability and resting heart rate can shift with stress and sleep quality, but they also respond to dehydration, illness, caffeine, alcohol, and even room temperature. Sleep duration and fragmentation reflect recovery opportunities, yet they do not guarantee that muscle repair or autonomic balance has fully returned.
Real-world situations make these limitations obvious. A person with a cold may show low recovery scores even if they feel “mostly fine,” because autonomic and inflammatory signals change before symptoms become obvious. Another person may show a high score despite soreness because the algorithm weights sleep and resting heart rate more than muscle soreness. A third person may get a low score after a long workday with poor sleep, even if training load was modest.
When people treat the score as a direct measure of readiness, they can misinterpret the cause. A low score might reflect poor sleep rather than insufficient training recovery. A high score might reflect stable heart rate patterns despite lingering soreness. Over time, this mismatch can lead to training decisions that either under-challenge or over-challenge the body.
Common Misreads That Cause Problems
Many users focus on the absolute number rather than the pattern. If your baseline is stable, a relative drop from your own typical range can be more informative than the score’s label. Absolute thresholds often vary across devices because the score is a scaled output, not a standardized lab measure.
Another frequent error is ignoring context. Heart rate-based signals change with caffeine timing, hydration status, altitude, stress at work, and menstrual cycle phase. If you travel across time zones, your sleep timing and circadian alignment shift, and the algorithm may interpret that as poor recovery even when training readiness is not the limiting factor.
Some people also overreact to short-term fluctuations. A single night of fragmented sleep can lower recovery scores for a day or two, even if your overall recovery is adequate. Conversely, a week of consistent sleep can keep scores high even when training load is rising, which can mask accumulating fatigue if the algorithm underweights training strain.
Finally, users sometimes assume the score reflects muscle recovery. Most wearable scores are derived from autonomic and sleep-related signals, which correlate with readiness but do not directly measure muscle damage or repair. Delayed onset muscle soreness can persist even when heart rate patterns normalize.
How To Interpret Scores Safely
Track Trends, Not One-Off Numbers
Use recovery scores as a trend signal. Compare today’s score to your own 2–4 week pattern rather than to a universal “good” or “bad” threshold. In practice, you can record the score alongside training intensity and sleep quality for a few weeks, then look for consistent relationships. For example, if your score drops after late nights and your performance feels worse the next day, that pattern is actionable even if the absolute score differs from another device.
Tools and methods include exporting weekly summaries, using the app’s “baseline” or “personal range” view if available, and writing down key context factors such as bedtime, caffeine timing, and long travel days. A realistic expectation is that scores can fluctuate day to day, while meaningful changes often show up over several days.
Check What Inputs Drive The Score
Review the app’s explanations for the score components. Some apps describe the weight given to sleep duration, sleep stages, resting heart rate, heart rate variability, or movement. Others provide limited transparency. If the app lists components, treat them as clues about what the score is likely responding to.
In practice, you can test the interpretation by changing one factor at a time. For instance, keep training intensity similar for several days while improving sleep timing, then observe whether the score rises. If the score does not change, the algorithm may rely more on heart rate patterns than on sleep duration, or it may require a longer baseline window.
Relevant tools include device settings for heart rate measurement frequency, sleep tracking accuracy checks, and ensuring the sensor fits consistently. If the wearable frequently loses contact, heart rate variability estimates can become unreliable, which can distort the score.
Use Recovery Scores With Training Load
Combine recovery scores with a training load measure you already track, such as session duration, distance, pace, resistance, or perceived exertion. The goal is to avoid decisions based on a single metric. A low recovery score paired with high training load suggests a higher chance of accumulating fatigue, while a low score paired with low load may point to sleep or stress as the main driver.
In practice, you can set decision rules that reference both signals. For example, if the score drops and the next session would normally be intense, choose a shorter or lower-intensity session and reassess after one day. A realistic outcome is not “perfect readiness,” but fewer days where training feels disproportionately hard.
Tools include training logs, perceived exertion scales, and weekly summaries that show load trends. If your score stays low for several consecutive days despite reduced load, that pattern may reflect factors beyond training recovery, such as illness or persistent sleep disruption.
Know When To Pause And Reassess
Recovery scores should not override symptoms. If you have signs of illness, persistent fever, unusual shortness of breath, chest pain, or severe dizziness, wearable metrics should not be the deciding factor. In those situations, reassessment should focus on symptoms and medical guidance rather than score interpretation.
Even without dramatic symptoms, consider pausing intense training if the score is low for multiple days and resting heart rate rises compared with your baseline. A realistic expectation is that autonomic signals can lag behind how you feel, so the combination of low score plus worsening baseline heart rate can be a useful warning pattern.
Practical tools include comparing resting heart rate trends over 7–14 days, checking sleep consistency, and reviewing whether sensor contact was stable. If sensor contact was poor, treat the score as less reliable for that period.
Educational Case Examples
Case Example 1: Travel And Sleep Timing
A 34-year-old traveler flies across time zones and keeps training light for the first two days. Their wearable shows a low recovery score on the first night due to sleep timing disruption and elevated resting heart rate. The next day, the score improves even though the person still feels slightly jet-lagged. The key interpretation is that the algorithm likely responds strongly to circadian disruption and resting heart rate changes, so the score may normalize as sleep timing stabilizes.
Case Example 2: High Score With Soreness
A 41-year-old strength trainee completes a heavy lower-body session and experiences delayed onset muscle soreness for three days. Their wearable recovery score stays in the mid-to-high range because sleep duration is adequate and resting heart rate returns toward baseline. The person feels that the score does not match muscle soreness. This mismatch can occur because many recovery scores emphasize autonomic and sleep signals rather than direct muscle repair status.
Algorithm Differences Checklist
Use this checklist to compare how different wearables might behave and to decide how much weight to give the score.
| Question | What It Suggests | How To Use It | Red Flag |
|---|---|---|---|
| Does the app list score components? | The score likely reflects specific inputs like sleep or resting heart rate. | Match score changes to those inputs in your log. | No explanation and frequent sensor contact issues. |
| Do you see a personal baseline? | The algorithm may normalize to your history. | Use relative changes from your baseline. | Large score swings with stable sleep and load. |
| How does the score react to missed sleep? | Strong response suggests sleep weighting. | Treat low scores after poor sleep as expected. | Score stays low despite recovery sleep for a week. |
| Does it match how training feels? | Agreement suggests useful correlation for you. | Adjust intensity based on both score and perceived exertion. | Repeated mismatch across many sessions. |
| Is sensor contact stable? | Unstable contact can distort heart rate variability. | Recheck fit and measurement settings before trusting the score. | Frequent “no data” or irregular heart rate readings. |
Common Mistakes To Avoid
Do not compare recovery scores across different devices as if they share the same scale. Even when both show “0–100,” the mapping from physiology to score can differ, and the baseline normalization window can differ.
Avoid training decisions based on a single day’s score. Recovery processes unfold over multiple days, and heart rate and sleep signals can be influenced by short-term stressors like caffeine, alcohol, late meals, or a stressful commute.
Do not ignore sensor quality. If the wearable frequently loses contact, heart rate variability and resting heart rate trends can become noisy, which can create false lows or false highs.
Do not treat soreness as irrelevant. If muscle soreness persists, a high recovery score may still coexist with incomplete muscle repair. Pair the score with how the session feels and with your training load history.
Do not assume a low score always means “overtraining.” Illness, dehydration, poor sleep timing, and medication effects can shift autonomic signals. When low scores persist alongside symptoms, the priority should shift from training optimization to symptom assessment.
FAQ
Why do two wearables show different recovery scores?
They often use different sensor inputs, different preprocessing for motion and signal quality, and different decision logic that maps physiology to a scaled score. Even if both display a similar range, the underlying meaning can differ.
Can a high recovery score mean I am fully recovered?
A high score usually indicates favorable patterns in the signals the algorithm tracks, such as sleep and heart rate trends. It does not directly measure muscle repair or inflammation resolution, so soreness or lingering fatigue can still occur.
How many days of data should I use to judge recovery?
Two to four weeks of personal history helps establish a baseline, while day-to-day decisions often work better when you consider at least several consecutive days rather than a single reading.
What factors besides training affect recovery scores?
Sleep timing and fragmentation, caffeine and alcohol, hydration status, stress, travel across time zones, ambient temperature, and minor illness can all change heart rate and sleep-related signals that many algorithms rely on.
When should I stop relying on the score?
If you have concerning symptoms such as chest pain, severe shortness of breath, fainting, or persistent fever, score-based decisions should not guide activity. Also reduce reliance when sensor contact is unstable or data quality is poor.
Author's Insight
Recovery scores are best treated as a signal-processing output rather than a direct measurement of “readiness.” Algorithms differ because they weight inputs differently and because they normalize to personal history using device-specific baselines. A practical approach is to interpret scores through your own patterns, compare them with sleep and training load, and watch for persistent mismatches. When sensor quality is unreliable or symptoms suggest illness, the score should carry less weight than your clinical context.
Key Takeaways
- Recovery scores differ across devices because algorithms differ in inputs, preprocessing, and score mapping.
- Use trends and personal baselines rather than absolute thresholds, and pair scores with training load and perceived exertion.
- Low scores often reflect sleep disruption or stress physiology, not only training recovery.
- Sensor contact quality and context factors like travel, caffeine, and illness can change scores independent of training.
- Persistent low scores plus worsening baseline heart rate or symptoms warrants reassessment beyond wearable metrics.