Wearable Heart Metrics
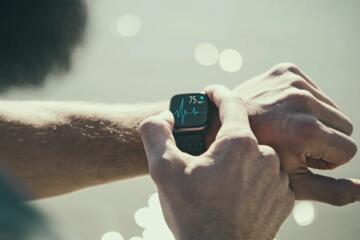
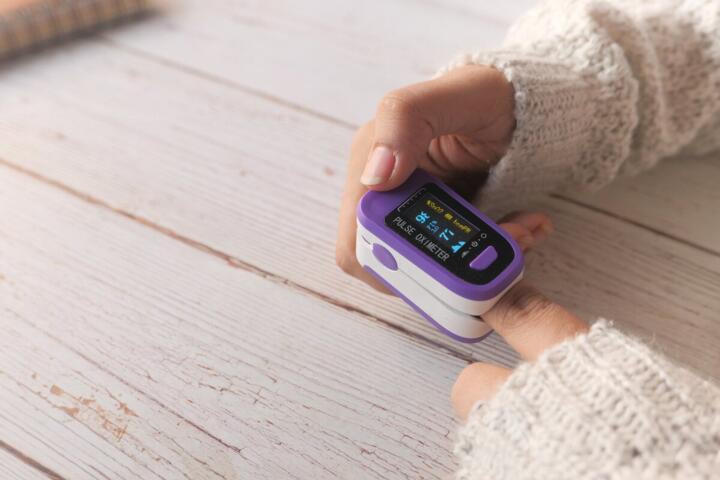
Wearable accuracy matters because HR, HRV, and SpO2 reflect different physiology and are measured with different sensor signals. Heart rate (HR) is the number of heart beats per minute, usually derived from optical pulse signals or, in some devices, from electrical signals. Heart rate variability (HRV) describes beat-to-beat timing variation, typically computed from the intervals between consecutive heartbeats. SpO2 estimates the percentage of oxygenated hemoglobin in arterial blood using red and infrared light absorption in a pulse oximeter sensor.
Practical examples show why the three metrics behave differently. During a brisk walk, HR often stays usable because the device can track pulse timing despite movement. HRV often becomes noisy because HRV depends on precise beat timing and small timing errors from motion can distort variability. SpO2 can drop temporarily with poor sensor contact or cold skin even when oxygenation is normal.
Accuracy also depends on the measurement context. Resting HR and HRV are usually more stable than values recorded during workouts. SpO2 readings are most interpretable when the sensor has steady contact and the user remains still enough for a consistent pulse signal.
Where Readings Go Wrong
People often treat HR, HRV, and SpO2 as interchangeable “health scores,” then compare them across days without considering sensor limitations. HR is relatively tolerant of small timing errors because it averages many beats over time. HRV is not tolerant of timing errors because it is computed from the exact pattern of beat intervals.
Optical sensors measure light changes caused by blood volume in superficial tissue. Motion changes the distance between the sensor and skin, shifts pressure, and alters the optical path. That produces artifacts that can be misread as pulse peaks or can smear the pulse waveform, degrading both HR and HRV. HRV is especially sensitive because many HRV metrics depend on detecting the correct sequence of beat-to-beat intervals.
Breathing and autonomic physiology also shape HRV. HRV decreases with stress, poor sleep, illness, and overtraining, but it can also change after caffeine, alcohol, dehydration, and even a late meal. If a wearable’s HRV algorithm filters out “bad beats” differently from day to day, the resulting HRV trend can reflect both physiology and algorithm behavior.
SpO2 has its own failure modes. Pulse oximetry assumes a pulsatile arterial signal and uses the ratio of red to infrared light absorption. Low perfusion (cold extremities, low blood pressure, vasoconstriction), skin pigmentation, nail polish, tattoos, and sensor misplacement can reduce signal quality. Some devices also struggle with motion artifacts, which can cause transient low SpO2 readings.
Real-world consequences differ by metric. Misreading HR during exercise can lead to training decisions that are off by a few beats per minute, which usually matters less than misreading HRV trends. Misinterpreting HRV during illness can cause unnecessary worry or missed recognition of worsening symptoms if the wearable is the only information source. Misinterpreting SpO2 can be risky when readings are used to judge respiratory status without considering measurement quality and symptoms.
How To Improve Data Quality
Stabilize Sensor Contact
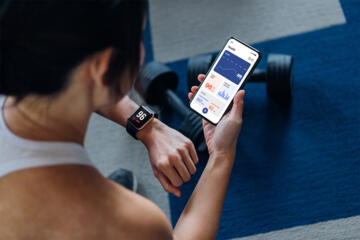
For HR and HRV, consistent skin contact improves the pulse signal and reduces missed or extra beat detections. Wear the device snugly enough that it does not slide, but not so tight that it causes discomfort or numbness. If your wrist is cold, warm the area before recording, since vasoconstriction can weaken the optical signal. In practice, you can check whether the device reports a “good signal” indicator or shows fewer quality warnings during rest.
For SpO2, sensor placement and steady contact matter even more. Keep the sensor aligned with the intended location and avoid reading while the sensor is loose or frequently lifted off the skin. In practice, a stable reading often appears after a short settling period when the waveform becomes steady.
Realistic expectation: even with good technique, optical wearables can show day-to-day variability from skin temperature, sweat, and minor strap position changes. Treat sudden changes that coincide with obvious sensor issues as less reliable.
Use Rest Windows For HRV
HRV is most interpretable when measured under consistent conditions because it reflects autonomic regulation and is sensitive to artifacts. Use a consistent rest window such as the same time of day and similar activity level, and avoid recording immediately after intense exercise, hot showers, or caffeine. In practice, many people get more consistent HRV by measuring after waking and sitting quietly for several minutes rather than during busy transitions.
Why this works: HRV algorithms rely on accurate beat interval detection, and motion or irregular breathing can distort the pulse waveform. A stable rest window reduces both physiological variability and measurement noise.
Realistic expectation: HRV values can still shift due to sleep quality, stress, hydration, and illness. The goal is not to chase a single “correct” number, but to observe trends within a consistent measurement routine.
Interpret SpO2 With Context
SpO2 should be interpreted alongside symptoms and measurement conditions. If you feel short of breath, have chest pain, or experience confusion, rely on clinical evaluation rather than a wearable reading. If you do not have symptoms, a single low SpO2 value often warrants rechecking after improving sensor contact and staying still for a minute.
Why this works: pulse oximetry estimates arterial oxygenation from a pulsatile signal, and motion or poor perfusion can create false low readings. In practice, recheck with the sensor properly positioned, warm hands, and minimal movement.
Realistic expectation: many consumer devices report SpO2 with limited precision compared with clinical-grade oximeters. Small fluctuations of a few percentage points can occur without true oxygenation changes.
Track Trends, Not Single Points
Wearables are better suited for pattern recognition than for exact measurement. For HR, look at whether your resting HR trend rises over several days alongside sleep disruption or illness symptoms. For HRV, focus on direction and consistency across rest windows rather than reacting to one low day. For SpO2, treat repeated low readings with stable sensor quality and symptoms as more meaningful than a single transient dip.
Why this works: measurement noise, algorithm filtering, and day-to-day sensor conditions can shift single readings. Trends reduce the impact of random error.
In practice, create simple rules such as “review HRV only from the same rest routine” and “recheck SpO2 after correcting sensor contact.” If your device provides a signal quality metric, use it to decide whether a reading should count.
Educational Case Examples
Scenario 1: HRV dip after a late night. A person records HRV each morning while seated. After a night with short sleep and late caffeine, HRV drops for two mornings. The device also shows stable signal quality and no unusual motion. The person compares the change to their usual baseline and notes that the dip aligns with sleep disruption rather than a sensor problem. They avoid making conclusions from a single day and instead watch whether HRV returns toward baseline after consistent sleep.
Scenario 2: SpO2 low during a cold commute. A person checks SpO2 on a cold morning while walking and sees a brief low value. They warm their hands, sit still, and repeat the measurement with better sensor contact. The second reading is higher and stable. The person treats the first low value as likely influenced by perfusion and motion rather than assuming a persistent oxygenation problem.
HR vs HRV vs SpO2 Checklist
| Metric | What It Reflects | Common Accuracy Limits | How To Interpret |
|---|---|---|---|
| HR | Beats per minute | Motion artifacts, poor optical signal, algorithm smoothing | Use averages over time; compare to your own patterns |
| HRV | Beat-to-beat timing variability | Beat detection errors, motion, inconsistent rest conditions | Prefer consistent rest windows; focus on trends |
| SpO2 | Estimated arterial oxygen saturation | Low perfusion, motion, sensor misplacement, skin/nail factors | Recheck with good signal; interpret with symptoms |
Step-by-step decision support:
- Check signal quality on the device screen or in the app; ignore readings flagged as poor quality.
- Match the measurement context: compare HRV only from similar rest conditions; compare HR from similar activity levels; compare SpO2 from similar sensor conditions.
- Look for persistence: one abnormal point is less informative than repeated changes across days or multiple consecutive readings.
- Use symptoms as a safety filter: if you have concerning symptoms, do not rely on wearable values alone.
Common Mistakes To Avoid
One frequent mistake is comparing HRV recorded during different states, such as measuring immediately after exercise one day and during quiet sitting another day. HRV changes with both physiology and measurement noise, so inconsistent conditions create misleading differences.
Another mistake is reacting to transient SpO2 dips without checking sensor quality. A brief low reading during movement or cold exposure can reflect poor signal rather than true oxygenation changes. Rechecking after warming and staying still reduces the chance of over-interpreting artifacts.
People also over-trust “single number” interpretations. HRV algorithms can vary in how they filter ectopic beats and artifacts, so the same physiological state can yield different HRV outputs across devices or even across updates.
A final mistake is ignoring device-specific behavior. Some wearables update HRV less frequently, average over different windows, or apply different smoothing for HR. Reading the device’s measurement description and quality indicators helps prevent false conclusions.
FAQ
Why does my HRV change on days I feel fine?
HRV varies with sleep timing, stress, hydration, caffeine, breathing patterns, and measurement conditions. Motion and inconsistent rest windows can also alter beat detection and HRV calculations, even when you feel normal.
Can SpO2 readings be falsely low?
Yes. Cold skin, low blood flow to the sensor, movement, and poor sensor contact can weaken the pulsatile signal and produce artificially low estimates. Rechecking with stable contact and minimal movement helps clarify whether the dip is an artifact.
Is wearable HR accurate during workouts?
Many devices track HR reasonably during steady activity, but accuracy can drop during high motion, irregular arm movements, or poor sensor contact. Comparing your wearable HR to your own consistent workout patterns is usually more informative than expecting lab-level precision.
Do HR and HRV measure the same thing?
No. HR counts beats per minute, while HRV reflects variability in beat timing. HR can remain stable while HRV changes due to autonomic regulation and measurement conditions.
When should I treat wearable readings as a safety concern?
If you have symptoms such as severe shortness of breath, chest pain, fainting, confusion, or persistent oxygen saturation concerns with stable sensor quality, seek medical evaluation. Wearables can be wrong, so symptoms and clinical assessment carry more weight than a single device reading.
Author's Insight
HR, HRV, and SpO2 come from different physiological signals and different sensor processing pipelines. HR tends to be more tolerant of minor timing errors because it averages over time, while HRV depends on precise beat interval detection and is more sensitive to motion and algorithm filtering. SpO2 relies on a pulsatile optical ratio and can be distorted by perfusion and sensor contact. For everyday monitoring, the most reliable approach is consistent measurement conditions, attention to signal quality, and interpretation of trends alongside symptoms rather than reacting to isolated values.
Key Takeaways
- HR is usually more stable than HRV, while HRV is more sensitive to motion and inconsistent rest conditions.
- SpO2 estimates can be affected by cold, low perfusion, and movement; recheck with good sensor contact.
- Use consistent measurement routines and focus on trends, not single readings.
- Do not rely on wearable numbers alone when symptoms suggest a serious problem.