CGM Data For Non-Diabetics
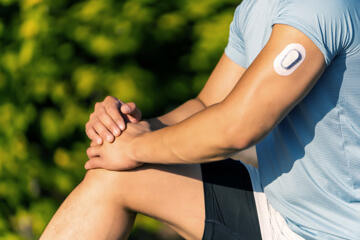
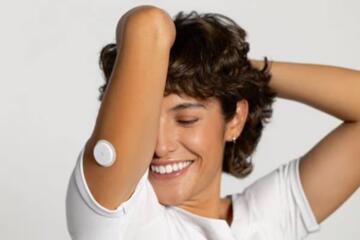
Continuous glucose monitoring measures glucose in the fluid between cells, not directly in blood. A sensor under the skin estimates glucose and sends readings to a receiver or phone app at short intervals, often every 1–5 minutes. For non-diabetics, the most useful output tends to be patterns: how quickly glucose rises after meals, how long levels stay elevated, and how exercise shifts the curve. Travel adds variables like meal timing, jet lag, alcohol, and activity changes, which can show up as day-to-day differences in the trace.
CGM reports usually include a current value, a trend arrow, and summary metrics such as time-in-range. Those metrics were designed for diabetes management, so non-diabetic interpretation needs extra caution. A “high” reading on a CGM does not automatically mean a medical problem; it can reflect sensor lag, calibration behavior, or normal physiology after a carbohydrate-heavy meal. The data can still be informative when you treat it as a measurement with known limitations rather than a diagnosis.
Common Misreads And Dependencies
People often treat CGM numbers as if they were lab blood glucose. CGMs estimate interstitial glucose, which typically lags behind blood glucose by several minutes, and the lag can vary with factors like blood flow and sensor placement. That lag matters when you interpret rapid changes after meals, during intense workouts, or right after alcohol. Another frequent mistake is assuming that “flat” glucose means “healthy” and “spiky” glucose means “unhealthy.” Glucose dynamics depend on meal composition, sleep, stress hormones, and recent activity.
Accuracy also depends on the device type and how it is used. Some sensors require fingerstick calibration during setup or when the system requests it; others are factory-calibrated but still can drift. Sensor performance can degrade with poor adhesion, dehydration, or skin irritation. Even the app version can change how graphs are displayed; for example, a reader might see different smoothing or alert thresholds after an update (I’ve seen this with app builds around 2024–2025, and it can change how “spikes” look).
CGM interpretation also depends on the supporting ecosystem: the phone app, the glucose algorithm, and the way you log meals and activity. If you do not record what you ate and when, the trace becomes hard to interpret. If you log only “breakfast” without portion size or carbohydrate content, you may misattribute changes to the wrong meal. A CGM can show that something changed; it cannot tell you why without context.
How To Use CGM Data
Check Sensor Reliability First
Before drawing conclusions, verify that the sensor is behaving plausibly. Look for consistent readings over the first day and watch for obvious artifacts such as sudden drops to near-zero followed by rapid rebound. If your system supports it, compare a CGM reading to a fingerstick blood glucose during a stable period, such as before a meal. Use the manufacturer’s guidance for calibration timing; calibrating too often or at the wrong time can worsen drift.
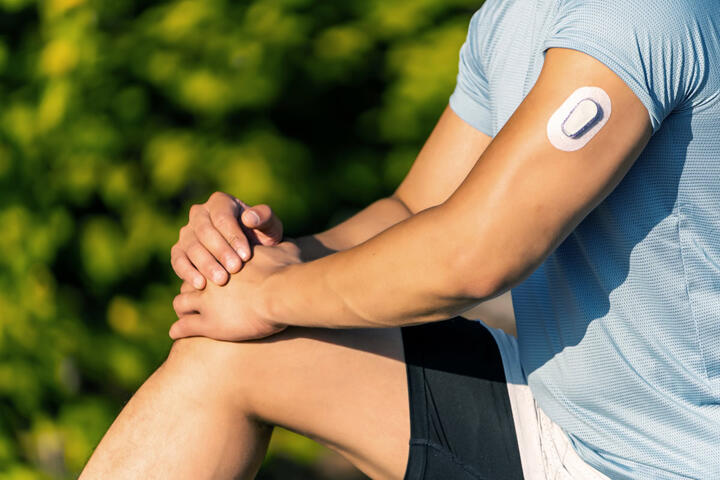
Practical travel tip: keep the sensor site dry and avoid tight straps that rub during flights or long walks. If you notice persistent discomfort, the sensor may be failing mechanically, and the trace can become noisy. Mild skin redness can be normal, but blistering or severe pain is a reason to stop and follow medical advice.
Interpret Trends, Not Single Numbers
Use the CGM curve to answer narrow questions. For meals, compare the shape across similar breakfasts or dinners rather than focusing on one peak. A common pattern is a rise after eating, a peak, and then a decline; the time-to-peak and the duration above your personal baseline often matter more than the exact peak value. For exercise, compare readings before, during, and after activity; some people see a delayed rise after high-intensity sessions, while others see a drop depending on glycogen status and timing.
Because CGM lags blood glucose, interpret short-term events with a buffer. If you start a workout at 10:00, the CGM response may show up closer to 10:05–10:15. That delay can look like “the exercise didn’t work,” when the trace is simply catching up.
Use Context Logs With Minimal Friction
Logging does not need to be perfect, but it must be consistent. Record meal start time, a rough portion description, and whether the meal included high-carbohydrate items (bread, rice, pasta, sweet drinks). Add one line for alcohol and one for sleep quality. If you use a third-party tracker, note that some apps export data differently; a CSV export from one tool may not match the graph scaling in another.
When you review a week of data, look for repeatable associations: “carb-heavy dinner late at night” followed by longer elevated periods, or “walk after dinner” followed by a faster decline. If you cannot find any repeatable pattern after several days, the issue may be inconsistent logging or normal day-to-day variability rather than a specific food effect.
Know When CGM Use Stops Being Informational
CGM can help you learn about glucose dynamics, but it does not replace medical evaluation. If you see persistent high readings across many days, especially with symptoms such as excessive thirst, frequent urination, unexplained weight loss, or recurrent infections, seek clinical advice. If CGM readings show frequent very low values, treat that as a safety issue and follow local medical guidance; do not assume “it’s just the sensor.”
Also watch for overinterpretation. A single unusual day during travel—late meals, alcohol, disrupted sleep—can distort your baseline. A more reliable approach is to compare similar conditions across multiple days, then decide whether a change in diet timing, meal composition, or activity scheduling improves the pattern.
Educational Case Examples
Scenario 1: Jet Lag and Meal Timing. A non-diabetic traveler uses a CGM during a 7-day trip with a 6-hour time shift. The trace shows higher peaks and longer elevated periods on the first two days, then gradually returns toward baseline after consistent meal timing. The person logs dinner start times and notices that late-night meals correlate with prolonged elevation, while a short post-dinner walk correlates with a faster decline. The lesson is not that jet lag “causes diabetes,” but that timing shifts can change glucose dynamics through sleep and meal scheduling.
Scenario 2: Exercise Timing Confusion. Another user tracks glucose around workouts. On days with morning high-intensity intervals, the CGM shows a delayed rise that peaks 20–40 minutes after the session begins, followed by a gradual decline. The user initially assumes the workout increased glucose, then repeats the pattern with a consistent warm-up and earlier breakfast. The trace becomes more predictable, suggesting that meal composition and timing, not the workout alone, drove the curve shape.
CGM Checklist For Decision Support
| Question | If Yes | If No | What To Do Next |
|---|---|---|---|
| Is the sensor trace stable? | Readings look consistent with normal meal responses | Frequent artifacts or implausible swings | Check site adhesion, follow calibration guidance, consider replacing sensor |
| Do patterns repeat? | Similar meals produce similar curve shapes | No repeatable associations | Improve logging consistency; compare weeks with similar schedules |
| Are you interpreting lag? | You use a few-minute buffer for meals/exercise | You judge events by the exact minute | Reframe analysis around time windows, not single timestamps |
| Any persistent abnormal values? | Mostly within expected personal baseline | Frequent highs or lows across days | Seek medical advice and use confirmatory blood tests |
Common Mistakes To Avoid
One mistake is chasing every alert. CGM alerts are tuned for diabetes risk management and can trigger on normal post-meal rises in non-diabetics. Turning off alerts can reduce stress, but you still need to review the trace periodically. Another mistake is changing multiple variables at once, like diet, exercise timing, and sleep schedule, then attributing changes to a single food.
People also misread “time-in-range” without understanding the thresholds. Those thresholds vary by device and clinical context, and non-diabetics do not have the same treatment targets. A third mistake is ignoring the sensor’s physical constraints. If the sensor is placed in a location that gets rubbed during travel, the readings can become unreliable, and the app may not flag the issue clearly.
Finally, avoid using CGM data as the only basis for medical decisions. If you want to assess metabolic health, clinicians typically rely on blood tests such as fasting plasma glucose, HbA1c, and sometimes an oral glucose tolerance test. CGM can complement those tests by showing day-to-day variability, but it cannot replace them.
FAQ
Can CGM Diagnose Diabetes In Non-Diabetics?
CGM readings can suggest abnormal glucose patterns, but they do not diagnose diabetes. Diagnosis uses blood tests such as HbA1c, fasting plasma glucose, or an oral glucose tolerance test, interpreted with clinical context.
How Accurate Are CGMs For People Without Diabetes?
CGM accuracy varies by device, sensor wear time, and conditions like calibration and skin perfusion. CGMs tend to be less reliable for very rapid glucose changes and during periods when the sensor signal is unstable.
Why Do CGM Readings Lag Behind Blood Glucose?
CGMs measure interstitial glucose, which changes after blood glucose changes. The delay can be several minutes and can vary with factors such as blood flow and sensor placement.
What Should I Do If My CGM Shows Low Values?
Confirm with a fingerstick blood glucose if you can, especially if symptoms occur. If low values are frequent or severe, seek medical advice rather than assuming the sensor is always wrong.
How Long Should I Wear A CGM To Learn Patterns?
A short period can show obvious meal and exercise effects, but travel and routine changes can distort results. Many people learn more from multiple days with consistent logging, then compare across similar schedules.
Author's Insight
CGM data for non-diabetics works best as a measurement of glucose dynamics, not as a stand-alone health score. Interstitial glucose lag, sensor drift, and device-specific algorithms mean that single peaks and dips rarely carry diagnostic weight. The most actionable use comes from repeatable patterns tied to meals, timing, and activity, supported by consistent logging. If you see persistent abnormal patterns, confirm with standard blood tests through a clinician rather than relying on CGM alone.
Key Takeaways
- CGM tracks interstitial glucose and typically lags behind blood glucose, so interpret timing with a buffer.
- Sensor reliability and stable placement matter; noisy traces can mislead.
- Look for repeatable trends across days, not single-number judgments.
- CGM complements medical testing; it does not replace diagnosis based on blood tests.
- Seek clinical advice for persistent abnormal readings or symptoms, especially if low values recur.