CGM Accuracy And MARD
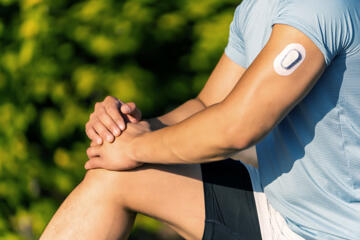
Continuous glucose monitors (CGMs) estimate glucose levels in the fluid between cells. Most CGMs measure glucose in interstitial fluid using an electrochemical sensor, then convert that signal into a glucose estimate displayed on a phone or receiver. Because interstitial fluid glucose lags behind blood glucose, CGM readings can differ from a fingerstick blood glucose measurement, especially during rapid glucose changes.
MARD stands for Mean Absolute Relative Difference. It summarizes how far CGM estimates deviate from reference blood glucose values, averaged over time. The “absolute” part means the metric treats overestimates and underestimates as positive differences, and the “relative” part scales the difference to the reference value. A lower MARD indicates closer average agreement with the reference method, but it does not describe the size of the worst errors or how often errors occur at specific glucose ranges.
For example, two CGMs can have the same MARD while one has more frequent small deviations and the other has fewer but larger deviations. MARD also does not tell you whether errors are biased in one direction during meals, exercise, or overnight. Interpreting CGM accuracy requires looking beyond a single number.
Common Accuracy Pitfalls
A frequent misunderstanding is treating CGM accuracy as a guarantee that each displayed value matches blood glucose at that moment. CGM accuracy is an average performance metric across many time points and conditions, not a promise for any single reading. The sensor’s signal depends on local tissue factors, sensor placement, and the time since insertion.
Another pitfall is ignoring the lag between interstitial and blood glucose. When glucose rises quickly after eating or drops quickly during exercise or insulin dosing, interstitial glucose may trail behind. This lag can make CGM graphs look “late” compared with fingerstick readings, even when the sensor is functioning as expected.
People also misread error patterns across glucose ranges. Many accuracy metrics behave differently at lower versus higher glucose levels because measurement noise and relative scaling change. At lower glucose, a small absolute difference can translate into a larger relative error, and the consequences of an incorrect estimate can be greater.
Biologically, CGM readings reflect glucose diffusion and local sensor chemistry. Tissue inflammation around the sensor can alter oxygen and fluid dynamics, affecting the electrochemical signal. Poor sensor contact, compression from sleeping on the sensor, dehydration, and rapid changes in glucose all increase the chance of mismatch with blood glucose.
In real-world situations, these issues show up during the first hours after sensor insertion, during rapid post-meal glucose excursions, and during periods of exercise or insulin adjustments. A person may see a CGM trend arrow that suggests a direction of change, yet the absolute value may still be off relative to blood glucose.
How To Interpret MARD
Use MARD As A Summary, Not A Prediction
MARD summarizes average deviation from reference blood glucose values. Use it to compare devices at a high level, not to predict the error of a specific reading. In practice, treat MARD like a “typical agreement” indicator rather than a real-time error estimate.
What this looks like: if two CGMs report similar MARD values, you may still see different behavior during meals or overnight. Device-specific algorithms for smoothing and trend estimation can change how the displayed curve responds to rapid changes.
Relevant method: compare MARD alongside how the device performs across glucose ranges and how often it reports values within a defined tolerance. Some accuracy reporting also includes percentages of readings within certain deviation thresholds, which can be more informative than MARD alone.
Understand Relative Error At Different Glucose Levels
Because MARD uses relative differences, the same absolute mismatch can produce different relative error depending on the reference glucose level. This matters when interpreting low glucose readings, where relative error can appear larger even if the absolute difference is small.
What this looks like: near hypoglycemia, a CGM may show a value that is close enough to indicate risk but still not identical to blood glucose. The trend direction may be more useful than the exact number, but confirmatory testing is appropriate when decisions depend on precise glucose values.
Practical tool: use the CGM’s trend information (direction and rate of change) along with context such as timing of meals, insulin dosing, and recent activity. If symptoms do not match the CGM, the mismatch can reflect lag, sensor error, or both.
Account For Lag And Rapid Changes
CGM lag is a predictable feature of measuring interstitial fluid rather than blood. The lag becomes more noticeable during rapid glucose excursions, such as after carbohydrate intake or during exercise. During these periods, the CGM may underestimate rising glucose or overestimate falling glucose depending on the direction of change.
What this looks like: after a meal, the CGM curve may rise after a short delay, then catch up. During exercise, the CGM may remain higher than blood glucose for a time as glucose drops.
Relevant method: interpret CGM readings in relation to timing. A practical approach is to look at the trend over the last 15–30 minutes rather than focusing on a single point, especially when glucose is changing quickly.
Use Confirmatory Checks When Decisions Depend On Precision
CGM readings can be used for day-to-day awareness, but confirmatory blood glucose testing is appropriate when accuracy is critical. The need for confirmation is higher when symptoms do not match the CGM, when readings are unexpectedly low or high, or when calibrations or sensor changes may affect performance.
What this looks like: if a CGM indicates a low glucose level but symptoms suggest a different state, a fingerstick check can clarify the situation. If the CGM is newly started, recently replaced, or has been affected by compression or sensor issues, confirmatory testing can reduce uncertainty.
Relevant tool: follow the device’s instructions for when to perform blood glucose checks and how to interpret sensor warm-up or calibration periods. Different CGM models have different behaviors during startup and sensor transitions.
Educational Case Examples
Meal-Related Lag And Over/Under-Estimation
An anonymized person eats a meal with fast-absorbing carbohydrates. The CGM shows a rising trend but the absolute value appears lower than a fingerstick taken shortly after the meal begins. Over the next 30–60 minutes, the CGM curve rises and aligns more closely with blood glucose. In this scenario, the mismatch reflects interstitial lag and rapid glucose change rather than a persistent sensor failure.
Low Glucose, Symptoms, And Error Patterns
An anonymized person experiences symptoms consistent with low glucose. The CGM displays a low value with a downward trend, but the person’s fingerstick check shows a higher glucose level than the CGM estimate. The CGM may be influenced by relative error near low ranges and by local sensor conditions. The person uses the fingerstick result for immediate decision-making and reviews CGM behavior over the following hour to understand whether the discrepancy persists.
MARD Vs Real-World Error
| Decision Context | What MARD Tells You | What MARD Does Not Tell You | Practical Check |
|---|---|---|---|
| Comparing devices | Average deviation from reference values | How errors behave during meals, exercise, or overnight for you | Review performance reporting across glucose ranges and conditions |
| Interpreting a single reading | Nothing about that specific time point | Whether the current value is over- or under-estimated | Use trend direction and consider a fingerstick when precision matters |
| Rapid glucose changes | Averages across many time points | Lag magnitude and error direction during fast rises/drops | Interpret over a window (e.g., 15–30 minutes) and match to timing |
| Low glucose range | Relative error averages can be summarized | Exact error size at your current glucose level | Confirm with blood glucose when symptoms and CGM disagree |
Common Mistakes With CGM
One mistake is reacting to a single CGM number without considering trend and timing. A CGM value can be temporarily off during rapid changes, while the trend direction may still reflect the direction of glucose movement.
Another mistake is ignoring sensor warm-up or startup behavior. Many CGMs show less stable readings early after insertion, and local tissue conditions can take time to settle. Treat early readings as provisional and follow the device’s instructions.
Compression artifacts are also common. Sleeping on the sensor, tight clothing, or prolonged pressure can alter local fluid flow and sensor signal, leading to spurious readings or abrupt changes.
People sometimes compare CGM and fingerstick measurements taken at different times. Because glucose changes quickly, even a 10–15 minute gap can create apparent “inaccuracy.” For meaningful comparison, measurements should be taken close together and interpreted with the expected lag in mind.
Finally, some users assume that calibrations or settings can fix all discrepancies. Calibration can adjust the device’s relationship to blood glucose, but it cannot remove lag, tissue effects, or sensor-specific limitations.
FAQ
What does MARD mean for my CGM readings?
MARD is the average absolute relative difference between CGM estimates and reference blood glucose values across many measurements. It summarizes typical agreement, not the error of any single reading.
Why can my CGM differ from a fingerstick?
CGMs measure interstitial fluid and glucose changes lag behind blood glucose. Sensor conditions, local tissue effects, and rapid glucose changes can also create differences.
Is a lower MARD always better in practice?
Lower MARD usually indicates closer average agreement, but it does not describe worst-case errors, frequency of large deviations, or performance during meals, exercise, or overnight for your specific situation.
How should I interpret CGM values during meals or exercise?
Focus on the trend over a short time window and consider timing. During rapid glucose changes, the absolute value may lag behind blood glucose, even when the direction of change is correct.
When should I confirm CGM readings with blood glucose?
Confirm when symptoms do not match the CGM, when readings are unexpectedly low or high, or when sensor conditions may be unreliable. Follow your device instructions for when confirmation is recommended.
Author's Insight
MARD is a useful summary metric because it turns many CGM-versus-blood comparisons into one number. The limitation is that it averages across time points and glucose ranges, so it cannot predict the error at a specific moment or under a specific set of conditions. Interstitial lag and tissue effects explain many real-world mismatches, especially during rapid glucose changes and near low glucose levels. Interpreting CGM accuracy works best when you combine MARD-level context with trend information, timing, and confirmatory blood glucose checks when precision matters.
Key Takeaways
- MARD summarizes average CGM deviation from reference blood glucose, not the accuracy of a single reading.
- CGMs measure interstitial fluid, so lag and rapid glucose changes can create temporary differences from fingerstick values.
- Error behavior can differ across glucose ranges, with relative error often more noticeable near hypoglycemia.
- Use CGM trends and context, and confirm with blood glucose when symptoms and CGM disagree or when decisions require higher precision.