Learning Smart Scale Metrics
Smart scales do more than record your weight; they provide various body composition indexes derived from bioelectrical impedance analysis (BIA). For instance, a commonly quoted number is body fat percentage, which estimates fat mass as a fraction of your total weight. Many smart scales, like the Withings Body+ (2023 version), also measure muscle mass, bone mass, and water percentage—metrics that can tell a more complete story of your physical condition.
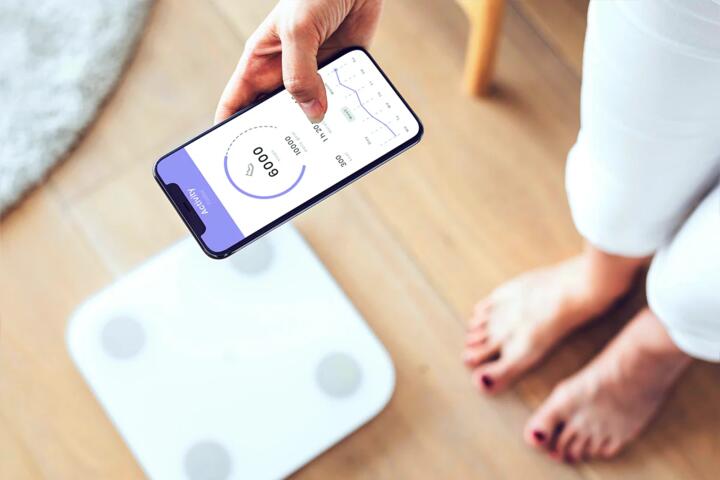
One fact to consider: the accuracy of fat percentage measurements can vary by up to 5% depending on hydration and time of day. Devices typically send data to companion smartphone apps, allowing daily tracking and trend spotting. Many users collect dozens of data points over weeks, but it’s the interpretation of these numbers that proves challenging.
Smart scales report data in multiple units and formats, often including BMI, basal metabolic rate (BMR), and visceral fat ratings. The average adult's hydration level should hover around 50-60%, though indicators can fluctuate widely. This spectrum of outputs can overwhelm newcomers who might rely on weight alone to judge health progress.
Misunderstandings & Risks
Many people mistakenly treat smart scale outputs as precise medical diagnostics rather than estimations. Relying on a single fat percentage reading to make diet decisions, for example, often leads to confusion—ones that provoke drastic and unnecessary changes. Inconsistent readings generally come from time-of-day differences, skin temperature, even dry skin.
Ignoring device limitations risks overestimating progress or setbacks. For example, muscle gain might not translate into immediate weight loss, despite improved body composition. Or, water retention can inflate weight but not change fat percentage much, which confuses users unfamiliar with fluctuations.
Some users get frustrated when muscle mass numbers rise unexpectedly or visceral fat ratings jump slightly—thinking their health is declining abruptly. These spikes, frankly, most scales handle poorly without context, often triggered by dehydration or recent meals. Lack of awareness about data nuances causes poor health choices and model abandonment.
Actions and User Advice
Track Consistently at One Time
Weigh yourself each day under similar conditions—after waking and restroom use but before eating or drinking. This reduces natural water fluctuations interfering with readings. Many choose morning times between 6 am and 9 am. Apps like Fitbit and Garmin sync data automatically, eliminating manual logging errors.
Focus on Trends Instead of Single Values
Daily numbers bounce unpredictably. Concentrate on 7-day or monthly averages. Should fat percentage decrease slowly while water stays stable, you've likely improved composition. Ignore day-to-day noise—no single measurement flags health status solidly. It’s patience that cracks the code.
Compare Metrics Selectively
Use muscle mass and fat percentage together to infer quality of weight changes. If overall weight rises but fat decreases and muscle increases, that’s progress even if scale weight misleads. Body water shifts reveal hydration status impacted by diet or exercise intensity that day.
Validate with Other Tools
Smart scales provide clues, not definitive answers. Complement their data by periodic skinfold caliper checks, DEXA scans if possible, or even simple tape measurements around waist and hips. That triangulation improves confidence in reported changes. One of my clients used a portable InBody scanner once a month alongside a smart scale; the differences helped recalibrate their expectations.
Understand Limitations of Devices
Most consumer models use BIA through feet sensors only—missing upper body detail and thus less accurate than professional setups with hand electrodes. Results vary by brand; Tanita and Omron produce different outputs for the same person. Recognizing this helps avoid comparing numbers across devices.
Use App Features Fully
Many scales provide metabolic age and visceral fat estimates. Treat these numbers as rough guides, not diagnostics. For example, a visceral fat rating around 10 on some scales signals moderate risk but must align with clinical tests for health decisions. Take advantage of app reminders and trend charts for motivation and insight rather than fixes.
Calibrate Expectations for Weight Loss
Don't expect steady drops every day. Human bodies fluctuate hundreds of grams of water and waste. A 0.5% change in fat over weeks is meaningful. Focusing on real change rather than immediate results encourages sustainable habits.
Leverage Community Data
Many apps include anonymized data comparison options—seeing percentile ranks or averages for your age and sex. These contextualize your numbers realistically. Some platforms allow export in standard formats (CSV, JSON) for deeper analysis on PC tools like Excel or R, a feature I like because it bypasses app oversimplifications.
Account for Medical Conditions
People with edema, pacemakers, or pregnant women should avoid bioelectrical scales or consult a healthcare professional before use. These conditions disrupt readings or carry risks with the electrical currents.
Real Life Examples
A fitness studio in Chicago started equipping clients with smart scales for initial and monthly check-ins. The biggest mistake: many viewed spikes in weight after strength training as setbacks. The trainers emphasized muscle-to-fat ratio tracking through app visuals, smoothing expectations. After three months, average fat loss was 2.4%, muscle mass rose by 1.8%, even though weight shifted just ±1 kg—highlighting compositional improvements missed by traditional scales alone.
Another case involved a woman monitoring hydration to tailor race-day preparations. She used body water percentages to adjust electrolyte intake and pacing strategies. This subtle data helped her avoid cramping, improving marathon time by 8 minutes—a clear example of nuanced metric application beyond weight alone.
Smart Scale Use Checklist
| Step | Action | Why | Outcome |
|---|---|---|---|
| 1 | Weigh same time daily | Reduces hydration effects | Consistent readings |
| 2 | Check averages weekly | Smooths daily fluctuations | Better progress view |
| 3 | Use complementary measurements | Confirms validity | More accurate |
| 4 | Understand device scope | Avoids wrong expectations | Trust built over time |
| 5 | Interpret trends, not spikes | Reduces anxiety about noise | Stable habits |
Errors That Undermine Use
Ignoring usage consistency remains the top mistake. Weighing in during varying states—after a run versus post-shower, for example—fuels data volatility. Another fault: overemphasis on single outputs like metabolic age, which is algorithmic fluff without clinical backing. Some users try comparing data from different brands, unaware scales use distinct impedance algorithms. This confuses progress and prompts abandonment.
Failing to sync data with apps or mistrusting companion software updates causes users to miss trend visualization and alerts. The apps also fail sometimes, which, frankly, most people skip troubleshooting.
Forgetting medical warnings—for instance, pregnant women using devices not cleared for pregnancy—poses health risks. Lastly, not combining smart scale results with lifestyle factors and fitness measures reduces the value of numbers to meaningless noise.
FAQ
How accurate are smart scale readings?
Smart scale accuracy varies. Weight tends to be within 0.2-0.5 kg of a calibrated scale, but fat percentage readings can deviate by 3-5%, influenced by hydration, skin temperature, and device quality.
Can smart scales measure muscle mass precisely?
Muscle mass estimates rely on bioelectrical impedance and predict lean body mass but do not distinguish muscle quality or specific muscles. They are rough indicators best tracked over time rather than absolute values.
What affects smart scale data consistency?
Hydration, amount of recent food, skin moisture, body temperature, and even foot placement influence BIA measurements, causing daily variance. Using the scale regularly under similar conditions reduces this noise.
Should I trust visceral fat ratings on scales?
Visceral fat ratings from smart scales give approximate risk categories but are not diagnostic. Clinical imaging or blood tests offer precise assessment. Use the rating as a gauge for lifestyle changes, not a verdict.
Are smart scales safe for everyone?
Most smart scales send a low electrical current safe for healthy users but contraindicate people with pacemakers, pregnant women, or those with certain implants. Always consult a doctor if unsure.
Author's Insight
My years working with smart scale data reveal that numbers alone don't improve health outcomes. Consistency in measurement timing, combined with education about the metrics, creates real value. Many neglect to contextualize fat percentage or muscle mass changes with activity or diet—that's a missed opportunity. I advise clients to focus on patterns over weeks, not individual readings. One 2022 client experienced a visible plateau but saw subtle fat loss reflected in averages, which encouraged them to keep going. Patience remains the best tool.
Final Thoughts
Smart scales offer detailed body composition data beyond weight, but interpreting these numbers demands attention to context and measurement practices. Focus on trends and combined metrics over time and supplement digital insights with physical checks or professional tests. Consistency, cautious skepticism of single snapshots, and alignment with lifestyle data help transform cold numbers into actionable knowledge. This approach elevates your understanding, leading to better, more sustainable health choices.